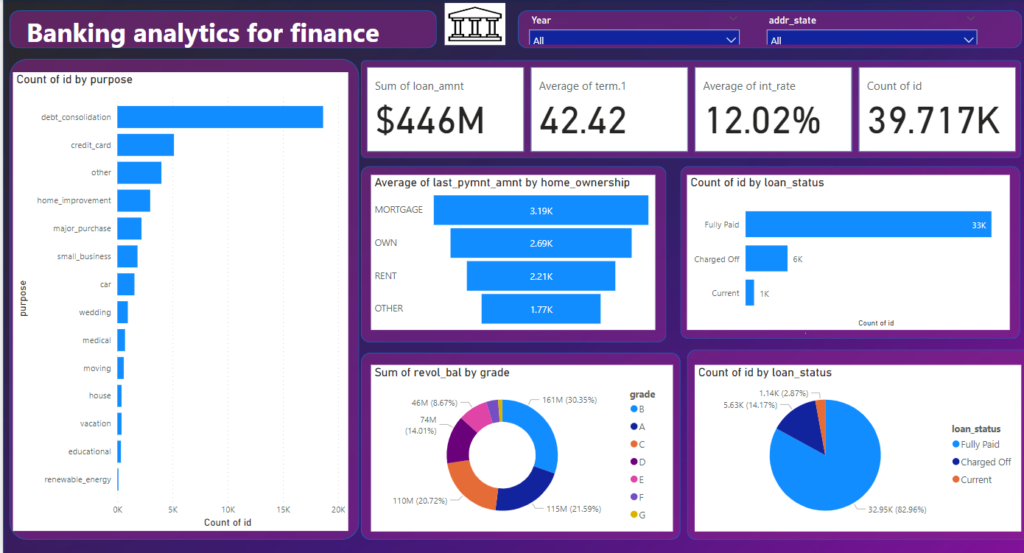
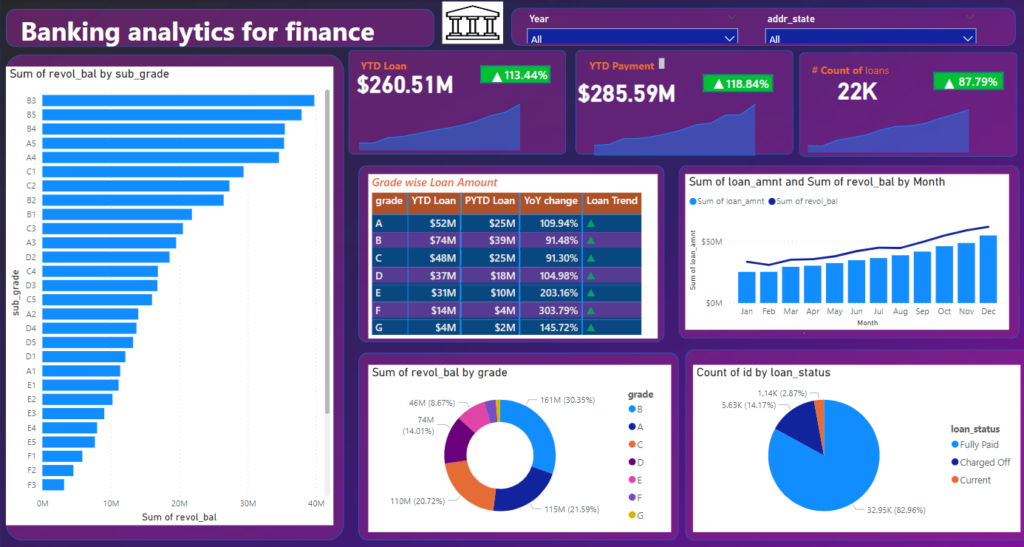
Dashboard-2:
Get data from Excel to the database:
DAX query to highlight highest:
Var_Highlight =
	Var
	_Highest =
		MAXX(ALLSELECTED(CM_productlines[productLine],
      CM_orderdetails[quantityOrdered]
)
	Var
	SWITCH(
		TRUE(),
		_highest = [Total_qty_ordered], "Green"
		,"Blue"
		)
	RETURN
        _highlight
Power query to extract Max and min date:
= List.Min(#"Changed Type1"[issue_d.1.1])
= Date.AddDays(List.Max(#"Changed Type1"[issue_d.1.1]),1)
= {Number.From(#"MinDate")..Number.From(#"MaxDate")}
Dax measure:
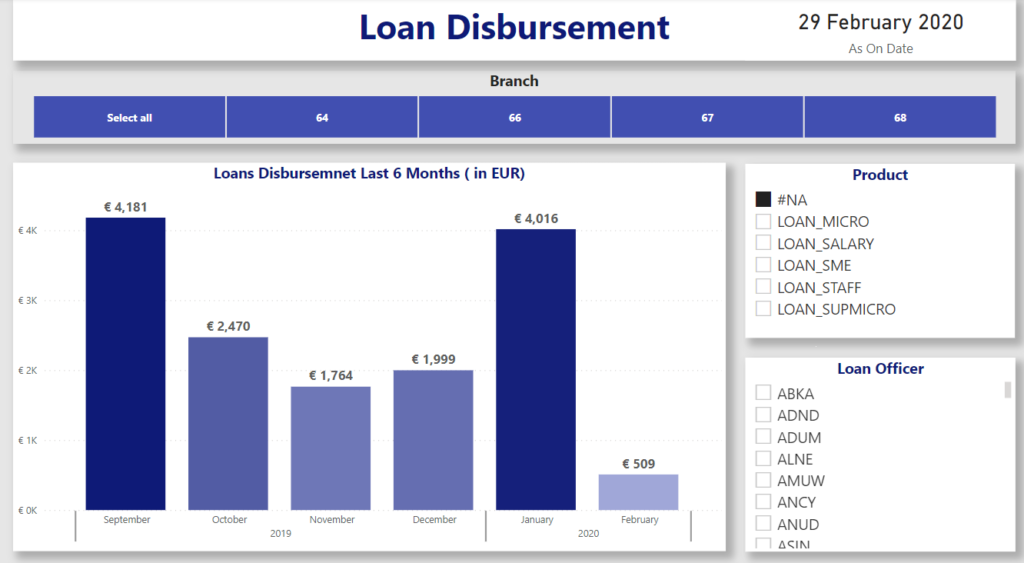
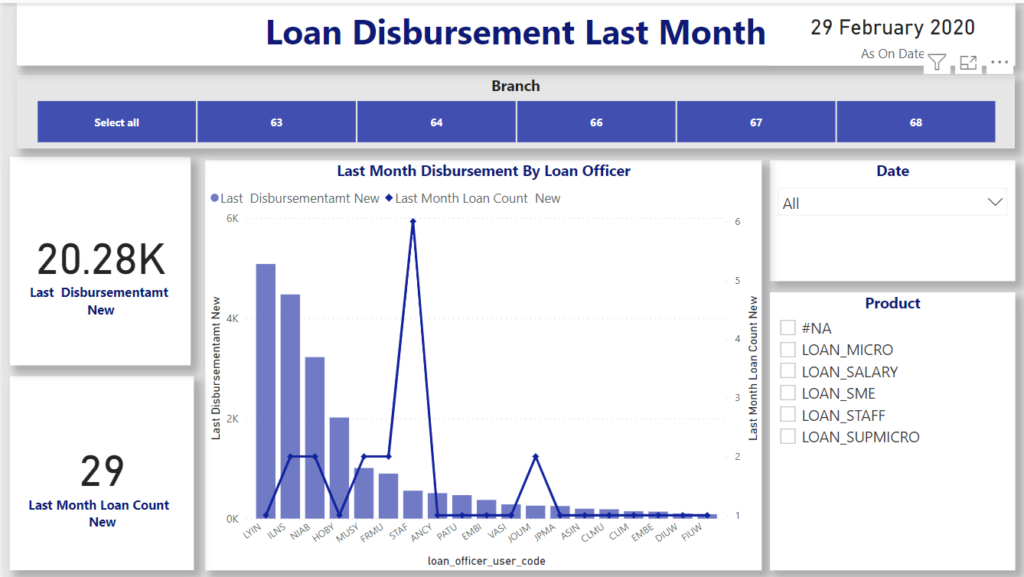
Monthly Disbursement for last month:
Monthly Disbursement for last 6 months =
 Var PrevMonthStart = EOMONTH( MAXX(DimDate,DimDate[FullDateAlternateKey]),-2)+1
 Var PrevMonthEnd   = EOMONTH( MAXX(DimDate,DimDate[FullDateAlternateKey]),-1)
return
CALCULATE(Sum('FactLoan'[principal_amount_eur]),FIlter(ALL(DimDate),DimDate[FullDateAlternateKey].[Date]>=PrevMonthStart && DimDate[FullDateAlternateKey].[Date] <=PrevMonthEnd
))
Last Month Loan Count  New =
 Var PrevMonthStart = EOMONTH( MAXX(DimDate,DimDate[FullDateAlternateKey]),-2)+1
 Var PrevMonthEnd   = EOMONTH( MAXX(DimDate,DimDate[FullDateAlternateKey]),-1)
return
CALCULATE(COUNT(FactLoan[loan_key]),FIlter(ALL(DimDate),DimDate[FullDateAlternateKey].[Date]>=PrevMonthStart && DimDate[FullDateAlternateKey].[Date] <=PrevMonthEnd
))
Portfolio at risk:
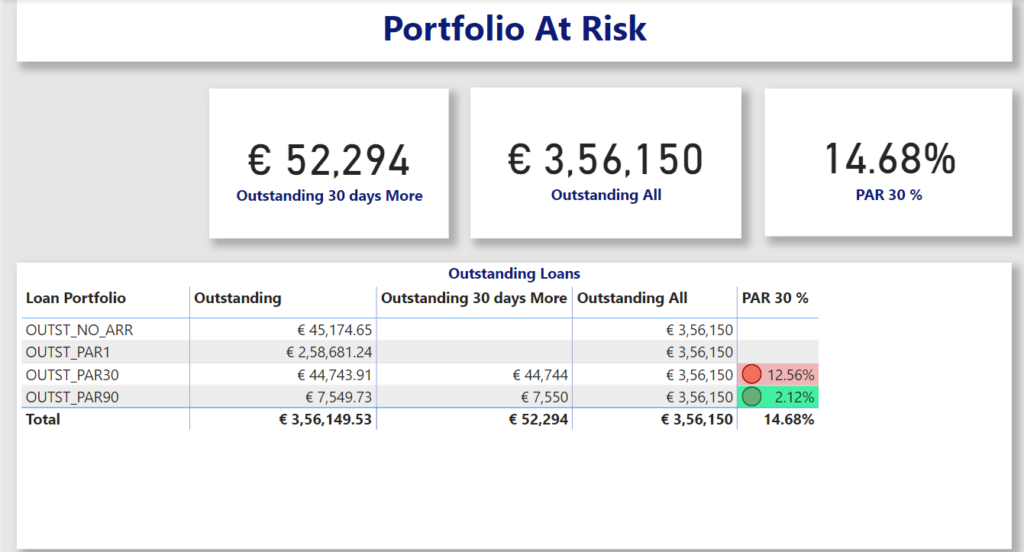
Outstanding All = CALCULATE(Sum(FactLoan[principal_amount_outstanding_eur]),fILTER(aLL(FactLoan), FactLoan[loan_status_key]="OUTSTANDING"))

Outstanding 30 days More = CALCULATE( Sum( FactLoan[principal_amount_outstanding_eur]),FactLoan[overdue_days] >=30 , FactLoan[loan_status_key]="OUTSTANDING")

PAR 30 % = divide( [Outstanding 30 days More],[Outstanding All])
Invalid loans report:
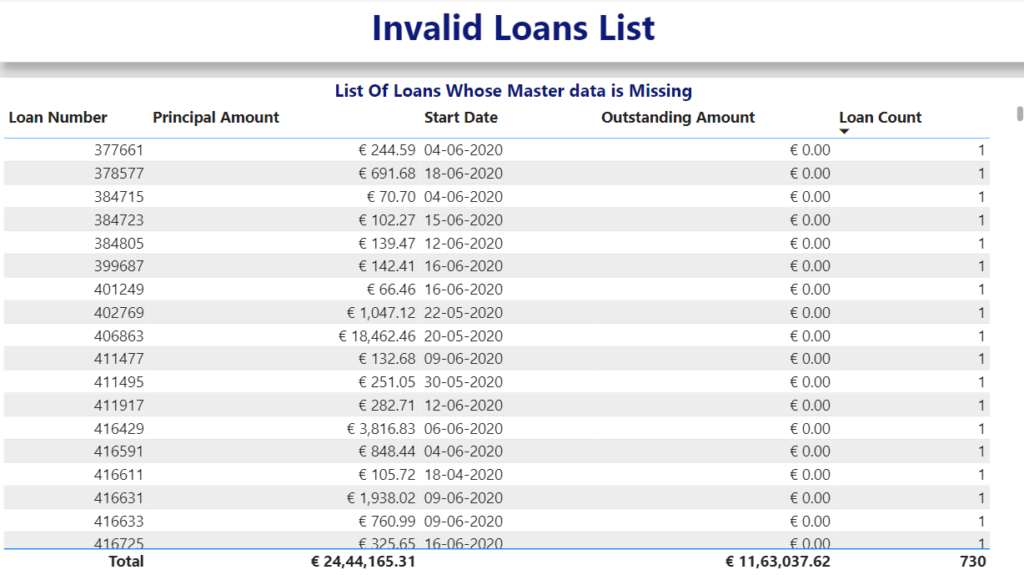
Grouping the table based on a category with max and min dates
= Table.AddIndexColumn([Count],"number",1,1)Inventory management:
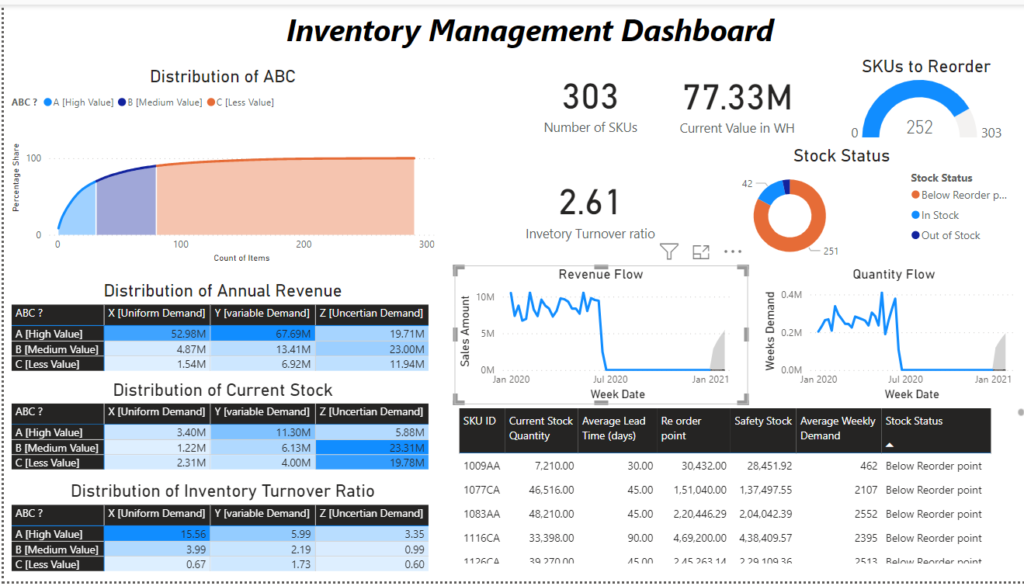
SKU – Stock Keeping Units, WH – WareHouse
Obj: Standardised weekly data sheet – per week sale of items
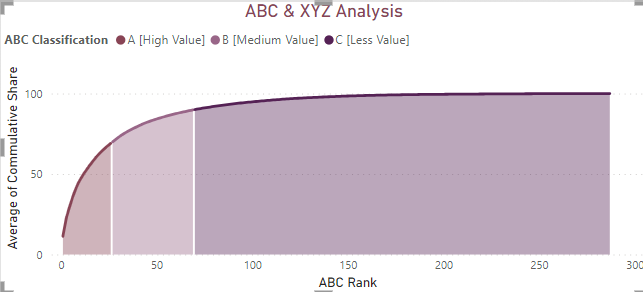
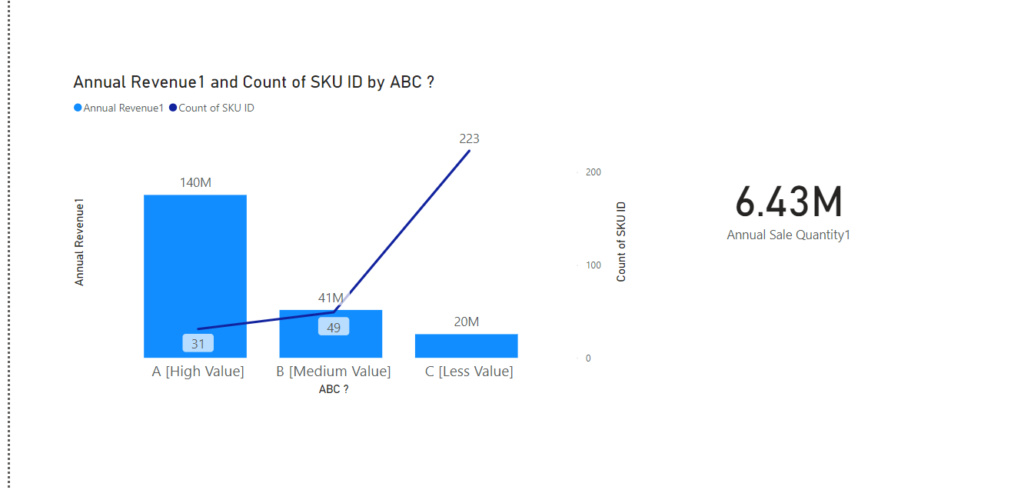
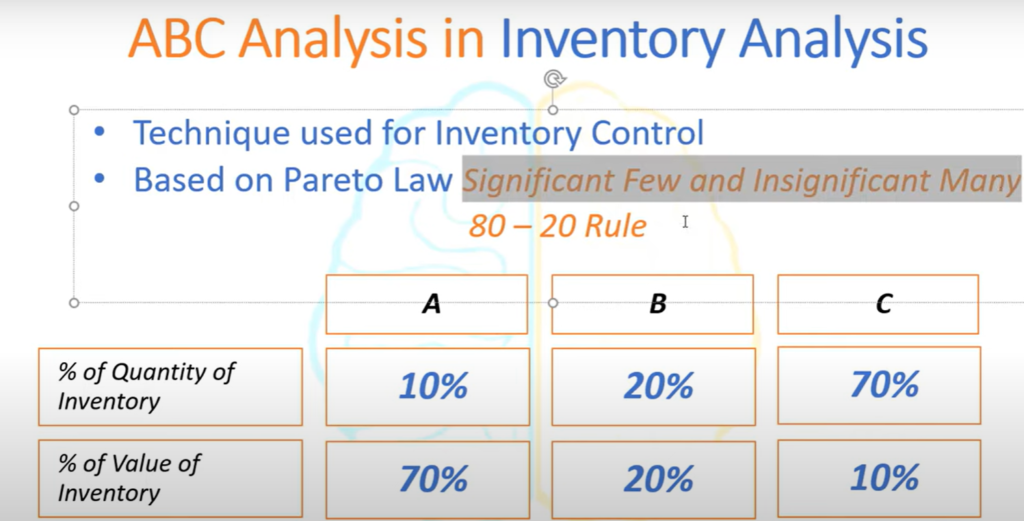
ABC analysis is a common inventory management technique for prioritizing items based on their value and impact for classifying and managing inventory effectively.
Annual sale quantity:
Objective: It calculates the total quantity of each item sold within the past 365 days, providing insight into annual sales performance.
Annual Sale Quantity1 = CALCULATE(
    sum('Past Orders'[Order Quantity]),
    FILTER('Past Orders',
    'Past Orders'[SKU ID]=Stock[SKU ID] &&
    'Past Orders'[Order Date]>=MAX('Past Orders'[Order Date])-365))+0
1. Annual Revenue1 = Stock[Annual Sale Quantity1]*Stock[Unit Price]
objective:
To calculate the annual revenue generated for each item in a stock.
2. Annual Revenue Share % = (100*Stock[Annual Revenue1])/SUM(Stock[Annual Revenue1])+0
Objective:
It calculates the percentage of total annual revenue contributed by each item in the stock.
3. Cumulative share calculates the percentage of total annual revenue contributed by each item in the stock.
Cummulative share = CALCULATE(
    SUM(Stock[Annual Revenue Share %]),
    FILTER(stock,
    Stock[Annual Revenue Share %]>= EARLIER(Stock[Annual Revenue Share %])))
The FILTER function includes only items from the Stock table where the Annual Revenue Share % is greater than or equal to the EARLIER value of the same column for the current item.
Pareto analysis:
Identify the top items that contribute the most to overall revenue (e.g., the top 20% of items might account for 80% of revenue).
ABC ? = if(Stock[Cummulative share]<=70,"A [High Value]",if(Stock[Cummulative share]<=90,"B [Medium Value]","C [Less Value]"))Rank:
This measure assigns a rank to each item in the Stock table based on their Cummulative share values, facilitating ABC classification for inventory prioritization.
ABC rank = RANK.EQ(Stock[Cummulative share],Stock[Cummulative share],ASC)Pareto principle: ABC test: 80% revenue share lies with 20% items
Annual Sale Quantity1 = CALCULATE(
    sum('Past Orders'[Order Quantity]),
    FILTER('Past Orders',
    'Past Orders'[SKU ID]=Stock[SKU ID] &&
    'Past Orders'[Order Date]>=MAX('Past Orders'[Order Date].[Date])-365))

Annual Revenue1 = Stock[Annual Sale Quantity1]*Stock[Unit Price]

Revenue Share % = 100*Stock[Annual Revenue1]/SUM(Stock[Annual Revenue1])+0

Cummulative share = CALCULATE(
    SUM(Stock[Revenue Share %]),
    FILTER(stock,
    Stock[Revenue Share %]>=EARLIER(Stock[Revenue Share %])))

ABC ? = if(Stock[Cummulative share]<=70,"A [High Value]",if(Stock[Cummulative share]<=90,"B [Medium Value]","C [Less Value]"))

# used for generating paretochart
ABC rank = RANK.EQ(Stock[Cummulative share],Stock[Cummulative share],ASC)

Value in WH = Stock[Current Stock Quantity]*Stock[Unit Price]

Inventory Turnover ratio = SUM(Stock[Annual Revenue1])/sum(Stock[Value in WH])
Interpretation of ABC analysis: More revenue is generated by a lesser number of items
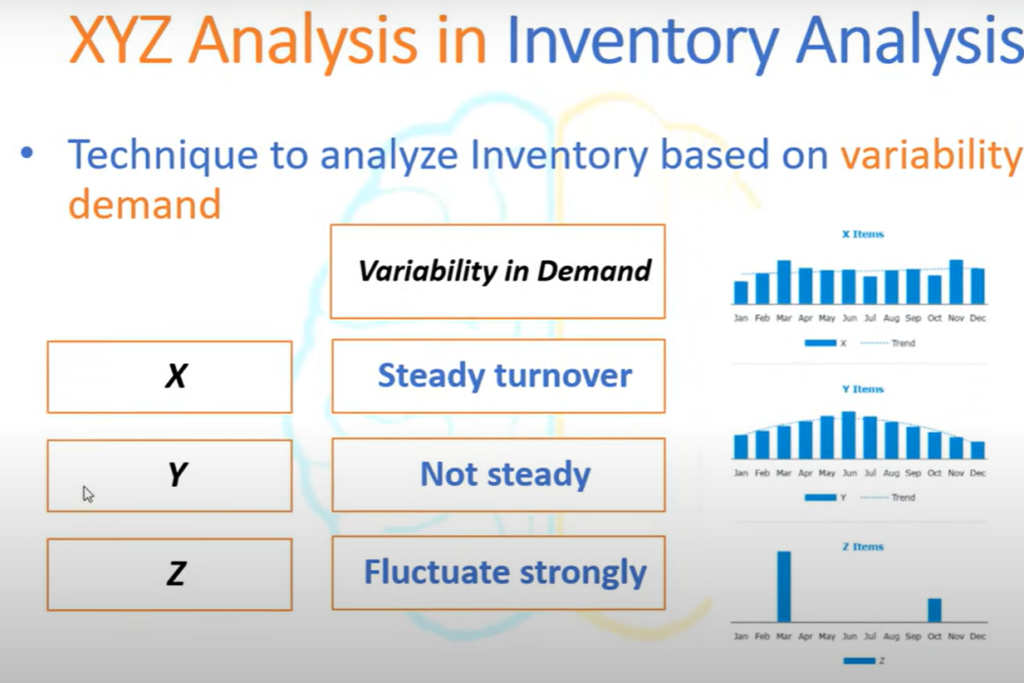
XYZ classification: For categorizing items by demand certainty
SKU Table = SUMMARIZE(Stock,
 Stock[SKU ID])
Week Table1 = GENERATESERIES(Max('Past Orders'[Order Date])-365,MAX('Past Orders'[Order Date]),7)
Weekly Demand Sheet = GENERATE('Week Table1','SKU Table')
Weeks Demand = CALCULATE(
    SUM('Past Orders'[Order Quantity]),
    FILTER(
        'Past Orders',
            'Past Orders'[SKU ID]='Weekly Demand Sheet'[SKU ID] &&
            'Past Orders'[Order Date]>='Weekly Demand Sheet'[Week Date]-6 &&
            'Past Orders'[Order Date]<='Weekly Demand Sheet'[Week Date]))+0
Sales Amount = LOOKUPVALUE(Stock[Unit Price],Stock[SKU ID],'Weekly Demand Sheet'[SKU ID])*'Weekly Demand Sheet'[Weeks Demand]
If the coefficient of variation is lesser the product has uniform demand but a higher CV(coefficient of variation) has uncertain demand.
X category – Less CV of weekly demand – Uniform demand – steady turnover – 20% of items
Y category – moderate CV of weekly demand – Variable demand – Not steady – 50% of items
Z category – High CV of weekly demand – Uncertain demand – Fluctuate strongly – 30% of items
DAX logic for ABC/XYZ analysis:
| Demand | Value | ||
| XYZ? | ABC? | ||
| CV rank | Cumulative share | ||
| CV of week demand | Annual revenue share % | ||
| Annual revenue | SD of weekly demand, Avg weekly demand |
Average Weekly Demand = CALCULATE(
    average('Weekly Demand Sheet'[Weeks Demand]),
        FILTER('Weekly Demand Sheet',
        'Weekly Demand Sheet'[SKU ID]=Stock[SKU ID]))

SD of Weekly Demand = CALCULATE(
    STDEV.P('Weekly Demand Sheet'[Weeks Demand]),
        FILTER('Weekly Demand Sheet',
        Stock[SKU ID] = 'Weekly Demand Sheet'[SKU ID]))

CV of Weekly Demand =
Stock[SD of Weekly Demand]/Stock[Average Weekly Demand]
if(Stock[SD of Weekly Demand]>0,Stock[SD of Weekly Demand]/Stock[Average Weekly Demand],1000)

CV rank = RANK.EQ(Stock[CV of Weekly Demand],Stock[CV of Weekly Demand],DESC)

XYZ ? = if(Stock[CV rank]<=0.2*max(Stock[CV rank]),"X [Uniform Demand]",if(Stock[CV rank]<=0.5*max(Stock[CV rank]),"Y [variable Demand]","Z [No Demand]"))
X [Uniform Demand]:
- If an item’s
CV rankis less than or equal to 20% of the maximumCV rankin the table, it’s classified as X. - This suggests relatively consistent demand patterns.
Y [Variable Demand]:
- If an item’s
CV rankis greater than 20% but less than or equal to 50% of the maximumCV rank, it’s classified as Y. - This indicates more variable demand patterns.
Z [No Demand]:
- If an item’s
CV rankis greater than 50% of the maximumCV rank, it’s classified as Z. - This potentially suggests very low or infrequent demand.
Inventory control measures:
To Allow more safety stock for items with variable demand (Y) to manage fluctuations.
Safety stock – is the buffer to maintain to avoid stockouts due to unexpected variations in demand or delivery times.
Peak Weekly Demand = CALCULATE(
    MAX('Weekly Demand Sheet'[Weeks Demand]),
    FILTER('Weekly Demand Sheet',
    'Weekly Demand Sheet'[SKU ID]=Stock[SKU ID]))

Safety Stock = (Stock[Peak Weekly Demand]*Stock[Maximum Lead Time (days)]/7)-(Stock[Average Weekly Demand]*Stock[Average Lead Time (days)]/7)

Re order point = Stock[Safety Stock]+(Stock[Average Weekly Demand]*Stock[Average Lead Time (days)]/7)

Do we need to order? = if(Stock[Re order point]>Stock[Current Stock Quantity],"Yes","No")

Stock Status = if(Stock[Current Stock Quantity]=0,"Out of Stock",if(Stock[Do we need to order?]="yes","Below Reorder point","In Stock"))

SKUs to Reorder = CALCULATE(
    COUNT(Stock[SKU ID]),
    FILTER(Stock,
Stock[Do we need to order?]="yes")) 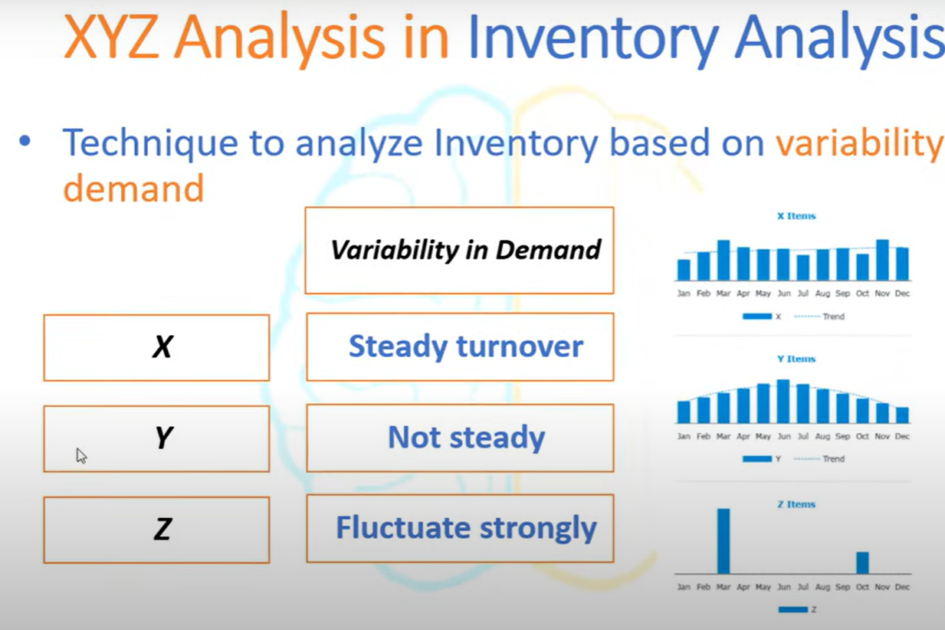
Recent Comments