Tag dashboard
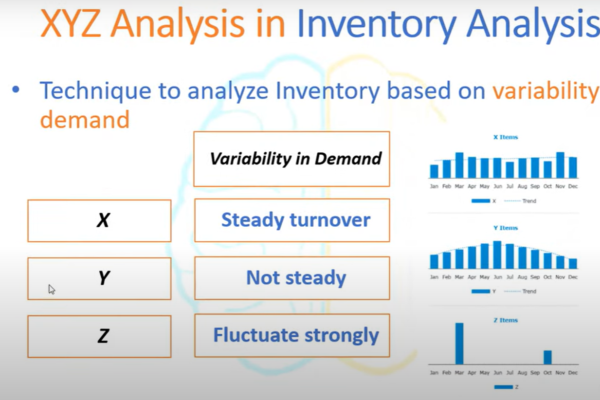
Power BI Inventory Management Dashboard: Supply Chain Analytics Modelling in PowerBI: General Calculation: Specific calculation: Revenue vs Revenue by orderDate: Power BI Inventory Management Dashboard: Power BI Inventory Management includes ABC Inventory Classification, XYZ Classification, Inventory Turnover Ratio, Calculation of… Continue Reading →
Dashboard-2: Get data from Excel to the database: DAX query to highlight highest: Power query to extract Max and min date: Dax measure: Monthly Disbursement for last month: Portfolio at risk: Invalid loans report: Grouping the table based on a… Continue Reading →
KPI’s as DAX measures for winning measures: CALCULATE used to calculate the number of matches.COUNTROWS counts the number of rows essentially counting the total number of matches in the dataset.a condition or filter is applied to checks if the “toss_winner”… Continue Reading →
Practice: Current Year sales: Previous Year Sales: Formatting profitablity: Steps building Dashboard: 1.First adjust dashboard size as per your requirement2.Ensure Floating selected and drag vertical container, Go to Layout and adjust its x,y and Height and Width3.Click on Tiled, Add… Continue Reading →


