Power BI Inventory Management Dashboard:
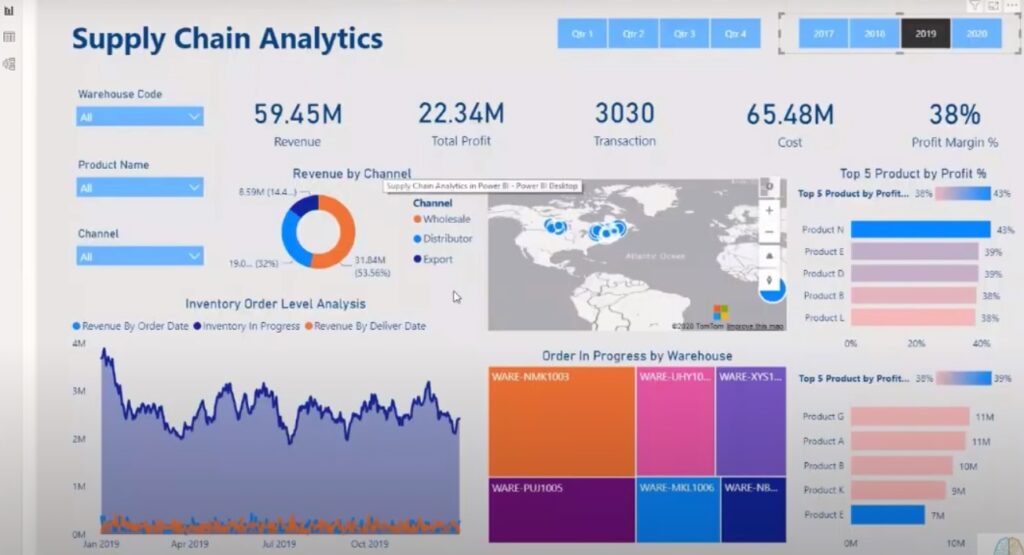
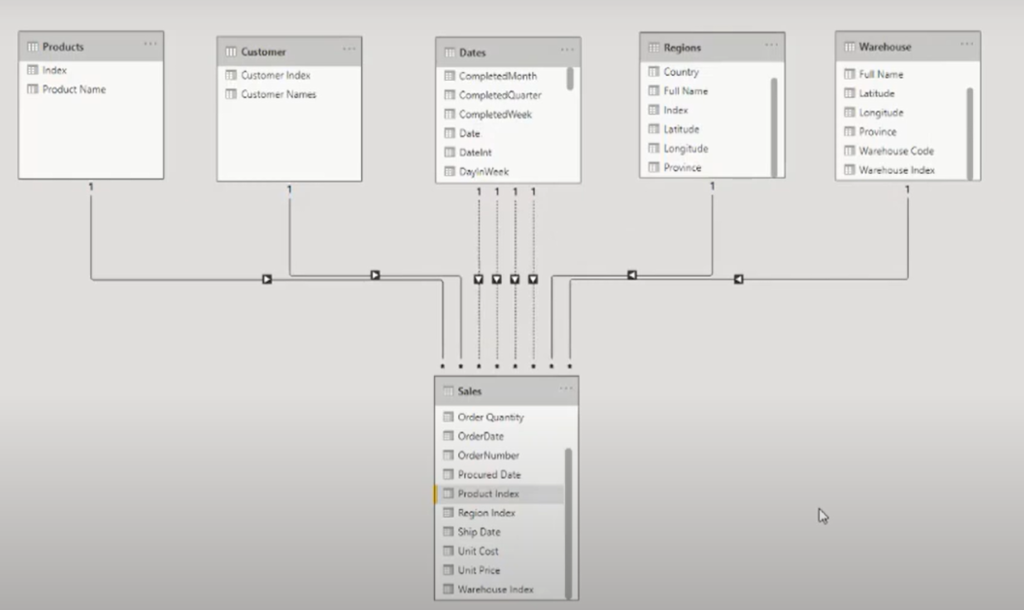
Supply Chain Analytics Modelling in PowerBI:
General Calculation:
Revenue = SUMX(Sales, Sales[Order Quantity]*Sales[Unit Price])
Cost = SUMX(Sales, Sales[Order Quantity]* Sales[Unit Cost])
Total profit = [Revenue]*[Cost]
Transactions(number of orders) = COUNTROWS(sales)
Specific calculation:
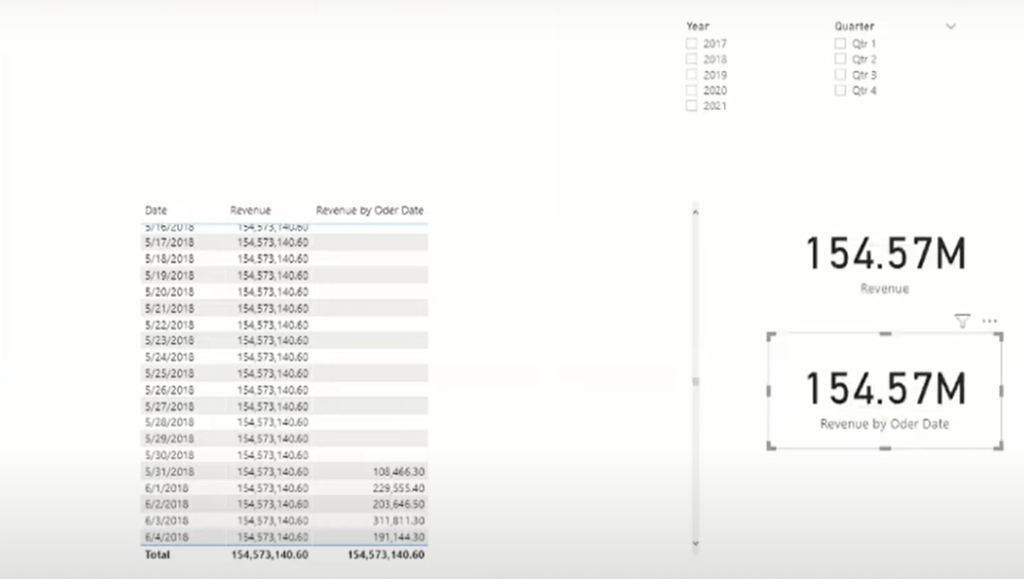
Revenue by orderDate = CALCULATE([Revenue], USERELATIONSHIP(Dates[Date], Sales[OrderDate]))
Cost by procuredDate = CALCULATE([Cost], USERELATIONSHIP(Dates[Date], Sales[procuredDate]))
Profit by order date = CALCULATE([Total profit], USERELATIONSHIP(Dates[Date], Sales[OrderDate]))
Revenue vs Revenue by orderDate:
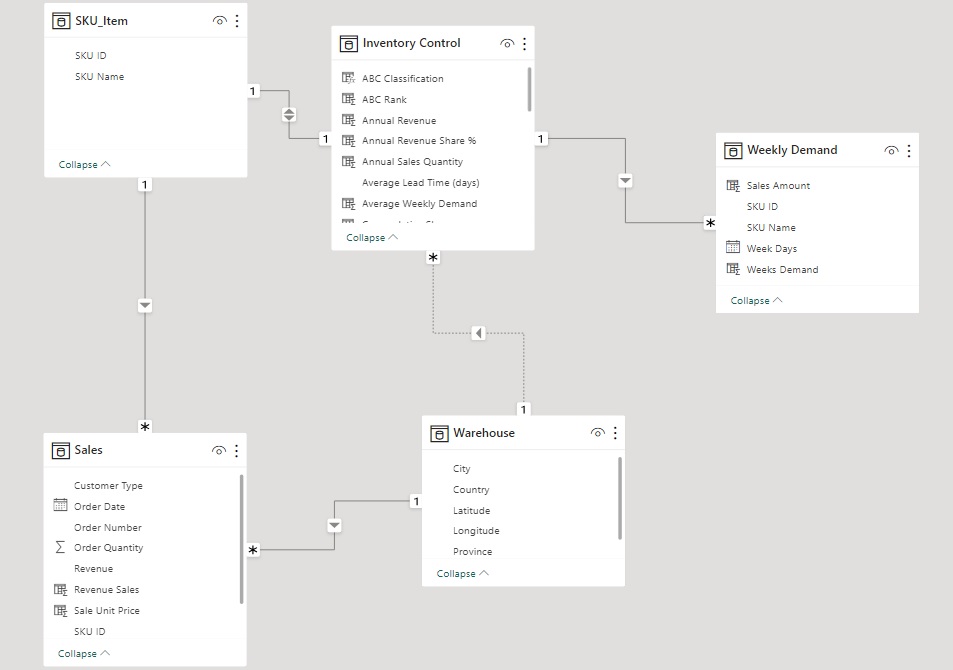
Power BI Inventory Management Dashboard:
Power BI Inventory Management includes ABC Inventory Classification, XYZ Classification, Inventory Turnover Ratio, Calculation of Safety Stock & Reorder points, Stock Status Classification, ABC Pareto Chart &
Demand Forecasting on Power BI.
It is extremely useful for Warehouse/ In-plant Inventory Managers to effectively control the Inventory levels and also maintain the Service Levels.
Power BI Inventory Management Modelling:
General Analysis using measures:
For each SKU’s calculate annual sale quantity from past orders. Note: To avoid blanks add ‘0’
Annual Sales Quantity1 = CALCULATE(
    sum('Past Orders'[Order Quantity]),
    FILTER('Past Orders',
    'Past Orders'[SKU ID]=Stock[SKU ID] &&
    'Past Orders'[Order Date]>= today()-365))+0

Annual Revenue1 = Stock[Annual Sale Quantity1]*Stock[Unit Price]

Annual Revenue Share % = (100*Stock[Annual Revenue1])/SUM(Stock[Annual Revenue1])+0
ABC analysis follows pareto principle:
First 70% of revenue share items are categorized as ‘A’
Second 20% of revenue share items are categorized as ‘B’
Third 10% of revenue share items are categorized as ‘C’
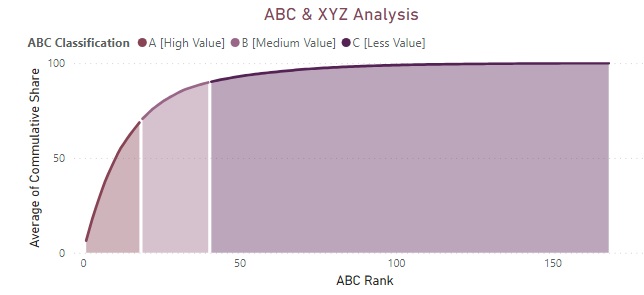
DAX measure for ABC:
ABC classification = if(Stock[Cumulative share]<=70,"A [High Value]",if(Stock[Cumulative share]<=90,"B [Medium Value]","C [Less Value]"))

Average of Cummulative Share = CALCULATE(
    SUM(Stock[Revenue Share %]),
    FILTER(stock,
    Stock[Revenue Share %]>=EARLIER(Stock[Revenue Share %])))

ABC rank = RANK.EQ(Stock[Cummulative share],Stock[Cummulative share],ASC)
Distribution of annual revenue:
Matrix visual with condensed style:
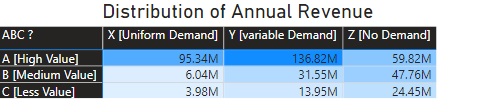
Rows – ABC classification, Columns – XYZ classification and Values – Sum of Annual Revenue
XYZ classification:
Categorizing items by demand certainty
X – constant demand
Y – Little variation in demand
Z – High/Uncertain variation in demand
XYZ classification = if(Stock[CV rank]<=0.2*max(Stock[CV rank]),"X [Uniform Demand]",if(Stock[CV rank]<=0.5*max(Stock[CV rank]),"Y [variable Demand]","Z [Uncertain Demand]"))
CV rank = RANK.EQ(Stock[CV of Weekly Demand],Stock[CV of Weekly Demand],DESC)
CV of Weekly Demand = Stock[SD of Weekly Demand]/Stock[Average Weekly Demand]
SD of Weekly Demand = CALCULATE(
STDEV.P('Weekly Demand Sheet'[Weeks Demand]),
FILTER('Weekly Demand Sheet',
Stock[SKU ID] = 'Weekly Demand Sheet'[SKU ID]))
Average Weekly Demand = CALCULATE(
average('Weekly Demand Sheet'[Weeks Demand]),
FILTER('Weekly Demand Sheet',
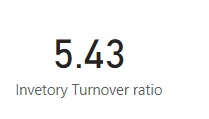
'Weekly Demand Sheet'[SKU ID]=Stock[SKU ID]))Distribution of Inventory turnover ratio:
Inv TurnOver Ratio = (Cost of Goods Sold Annually) / (Avg Inventory Value in WH)
Warehouse managers tend to reduce the stock and prefer faster moving of goods.
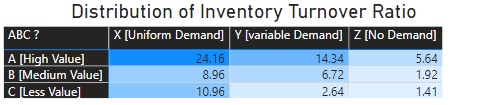
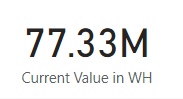
Inventory Turnover ratio = SUM(Stock[Annual Revenue1])/sum(Stock[Value in WH])Distribution of Current Stock:
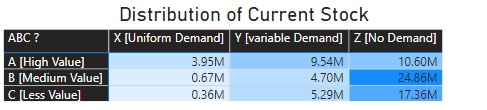
Current Value in WH = Stock[Current Stock Quantity]*Stock[Unit Price]GENERATESERIES generates last 1 year date:
To Standardized weekly data sheet that monitors per week sale of each items(SKU)
Week Table = GENERATESERIES(today()-365, Today(),7)In Weekly Demand table Week date, SKUID, Weeks demand
Weekly Demand Sheet = GENERATE('Week Table1','SKU Table')


Weeks Demand = CALCULATE(
    SUM('Past Orders'[Order Quantity]),
    FILTER('Past Orders',
    'Past Orders'[SKU ID]='Weekly Demand Sheet'[SKU ID] &&
    'Past Orders'[Order Date]>='Weekly Demand Sheet'[Week Date]-6 &&
    'Past Orders'[Order Date]<='Weekly Demand Sheet'[Week Date]))+0
Safety stock = (peak demand)*(Max Lead Time) – (Avg Demand) * (Avg Lead Time)
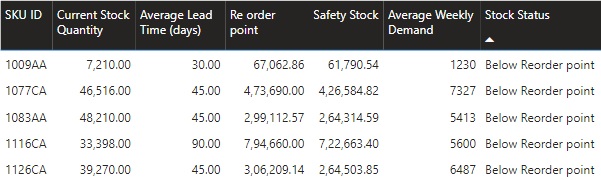
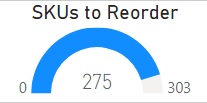
SKU’s to reorder:
SKUs to Reorder = CALCULATE(
    COUNT(Stock[SKU ID]),
    FILTER(Stock,
    Stock[Do we need to order?]="yes"))
Safety Stock = (Stock[Peak Weekly Demand]*Stock[Maximum Lead Time (days)]/7)-(Stock[Average Weekly Demand]*Stock[Average Lead Time (days)]/7)Reorder point = Safety stock + (Avg Demand)*(Avg Lead Time)
Re order point = Stock[Safety Stock]+(Stock[Average Weekly Demand]*Stock[Average Lead Time (days)]/7)Stock Status:
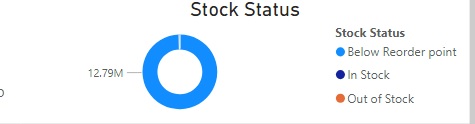
Stock Status = if(Stock[Current Stock Quantity]=0,"Out of Stock",if(Stock[Do we need to order?]="yes",
"Below Reorder point","In Stock"))

Do we need to order? = if(Stock[Re order point]>Stock[Current Stock Quantity],"Yes","No")
Key Measures:
SKUs to Reorder = CALCULATE(
    COUNT(Stock[SKU ID]),
    FILTER(Stock,
    Stock[Do we need to order?]="yes"))
Forecasting for demand planners:
Revenue Forescast:
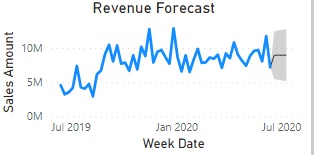
In Weekly Demand table Week date in X axis and sales amount in Y axis.
Week date = GENERATE('Week Table1','SKU Table')


Sales Amount = LOOKUPVALUE(Stock[Unit Price],Stock[SKU ID],'Weekly Demand Sheet'[SKU ID])*'Weekly Demand Sheet'[Weeks Demand]
Quantity Forecast:
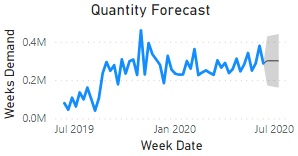
In Weekly Demand table Week date in X axis and Weeks Demand in Y axis.
Week date = GENERATE('Week Table1','SKU Table')

Weeks Demand = CALCULATE(
    SUM('Past Orders'[Order Quantity]),
    FILTER('Past Orders',
    'Past Orders'[SKU ID]='Weekly Demand Sheet'[SKU ID] &&
    'Past Orders'[Order Date]>='Weekly Demand Sheet'[Week Date]-6 &&
    'Past Orders'[Order Date]<='Weekly Demand Sheet'[Week Date]))+0
Recent Comments