Descriptive statistics using pandas:
These are the three steps we should perform to do statistical analysis on pandas dataframe.
- collect the data
- create the data frame
- get the descriptive statistics for pandas dataframe.
Collect the data:
To do any statistical analysis, first collection of data is the important task
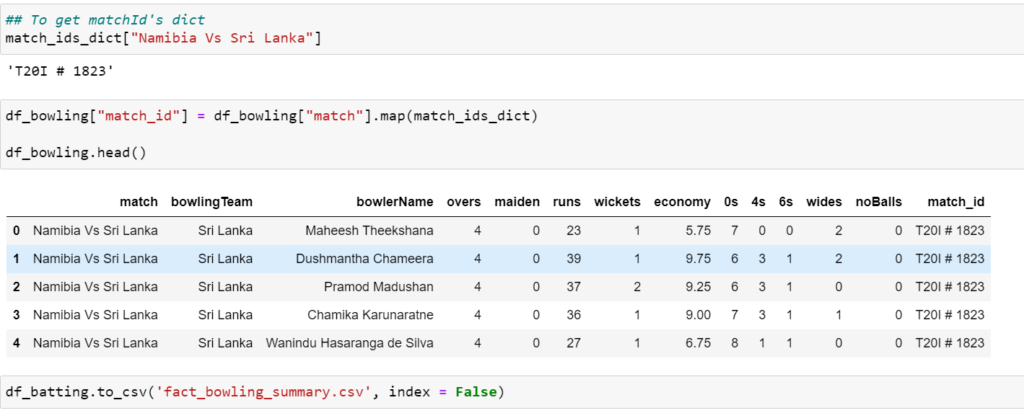
We can store the collected data in csv, excel, or in dictionary format. For Demo we store the home data in one csv file.
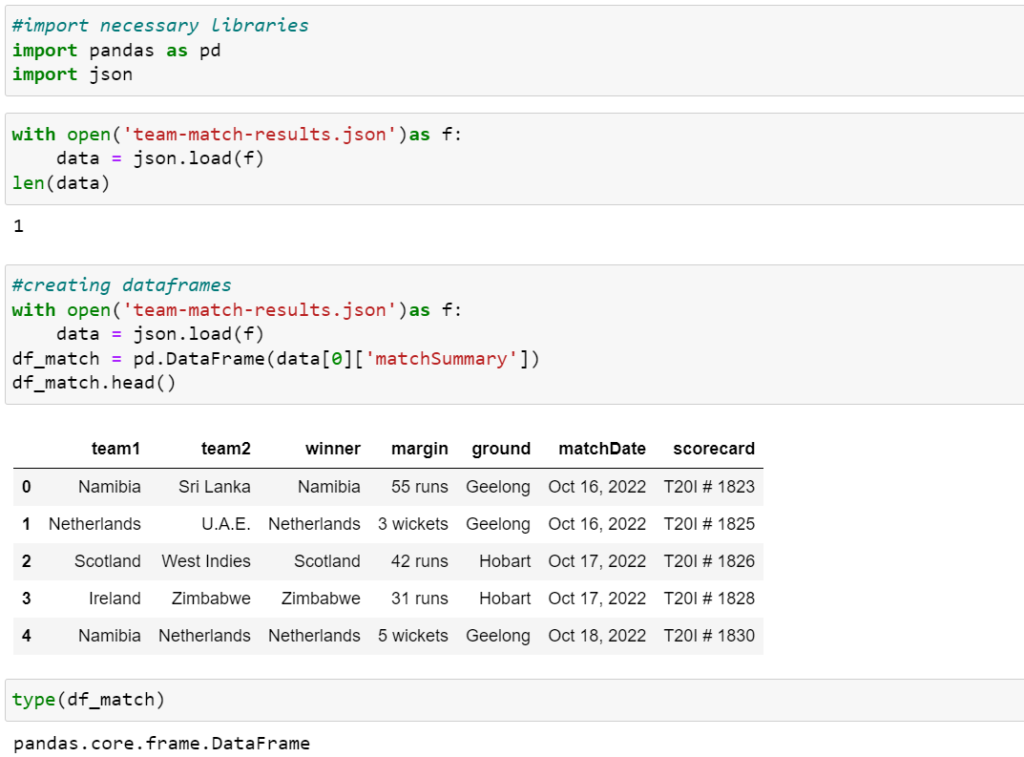
Data source:
- JSON, CSV, Excel
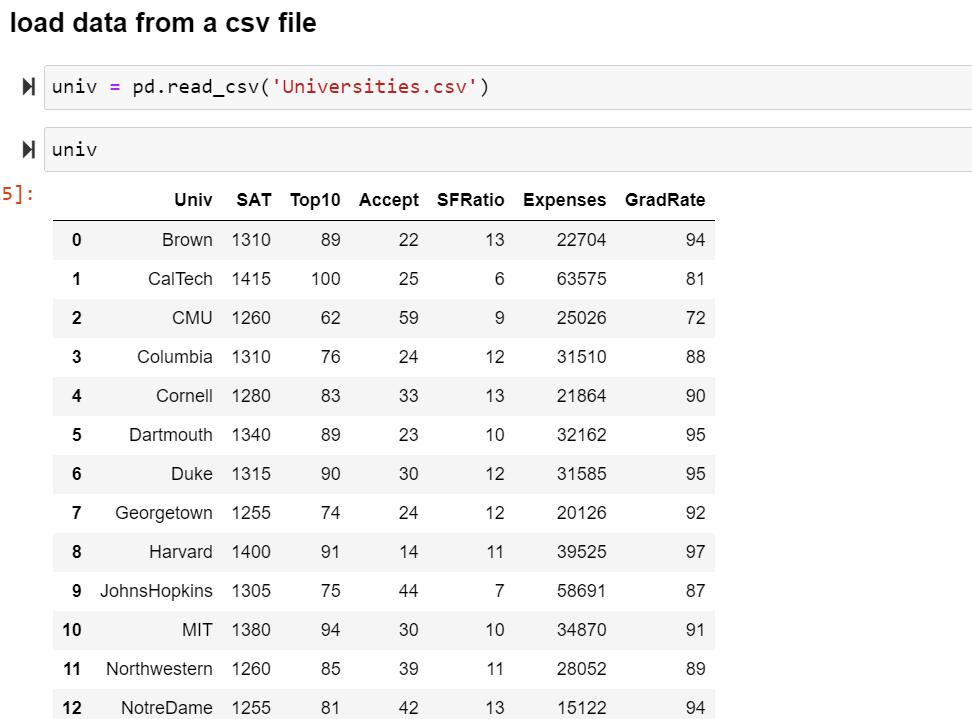
Create the data frame:
we need to create the data frame based on the data collected.
Give the homes csv file path location
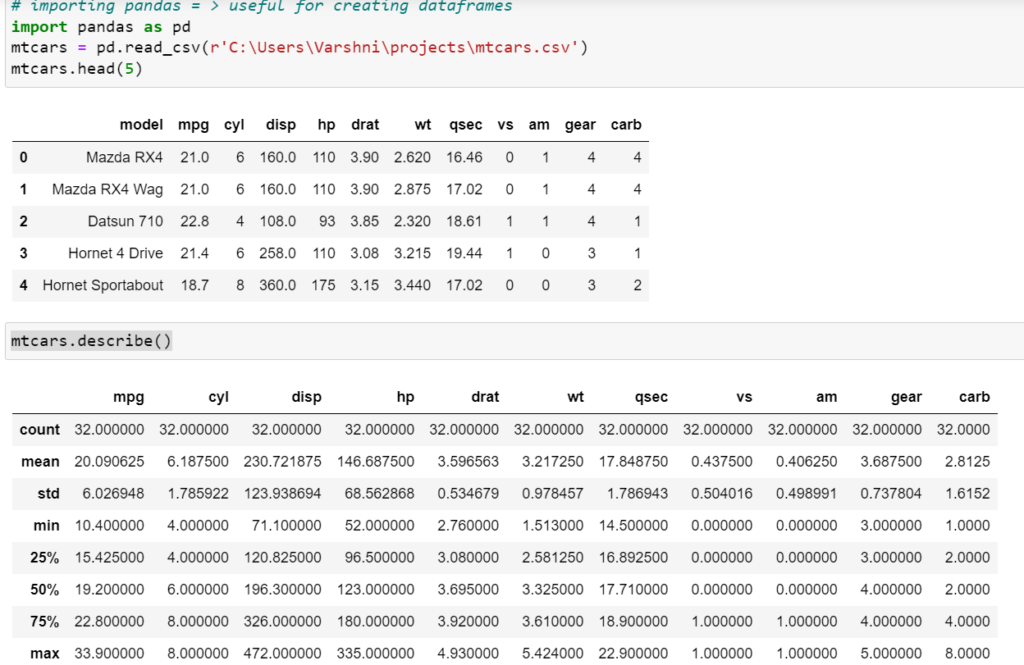
Get the Descriptive Statistics for Pandas DataFrame:
Once you have your Data Frame ready, you’ll be able to get the Descriptive Statistics. We can calculate the following statistics using the pandas package:
- Mean
- Total sum
- Maximum
- Minimum
- Count
- Median
- Standard deviation
- Variance
With describe function you will get complete descriptive stats
The syntax is: df.describe()
Through pandas, you get acquainted with your data by cleaning, transforming, and analyzing it. Python with Pandas is used in a wide range of fields including academic and commercial domains including finance, economics, Statistics, analytics, etc.
We can import the library or a dependency like pandas using the “import pandas” command. We now have access to many pre-built classes and functions.
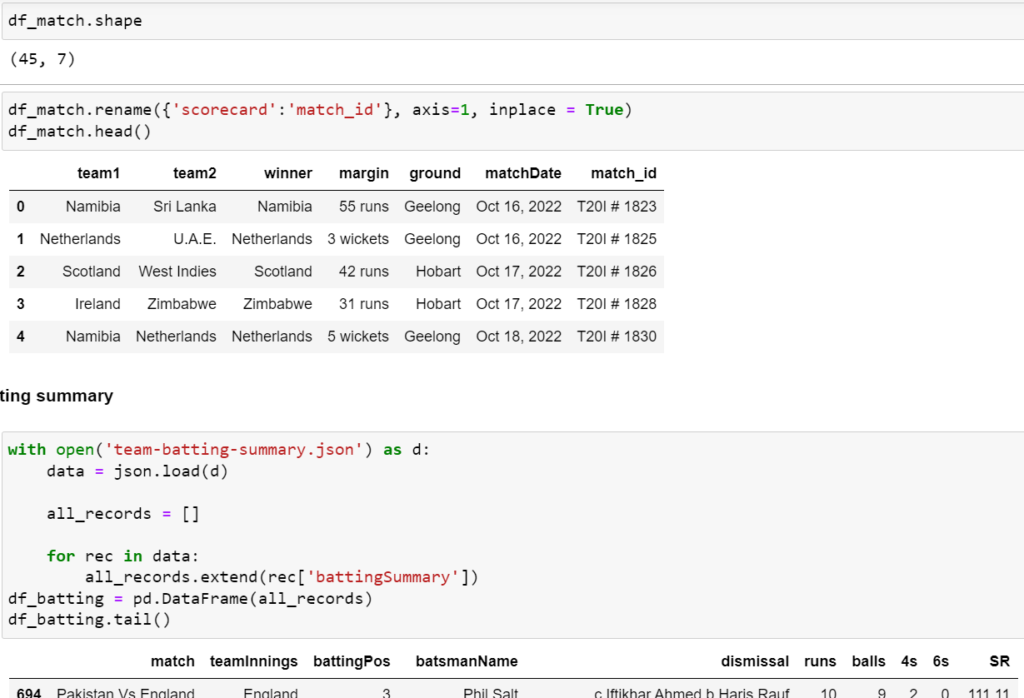
In order to be able to work with the data in Python, we’ll need to read the data(csv, excel ,dictionary,..) file into a Pandas DataFrame.
A DataFrame is a way to represent and work with tabular data. Tabular data has rows and columns, just like our csv file. In order to read in the data, we’ll need to use the pandas.read_csv function. This function will take in a csv file and return a DataFrame.
List:
List is a collection which is ordered and changeable. Allows duplicate members. A list is represented with square brackets. In many respects’ lists are like tuples, one key difference is they are mutable. Lists can contain strings, floats, integers We can nest other lists.
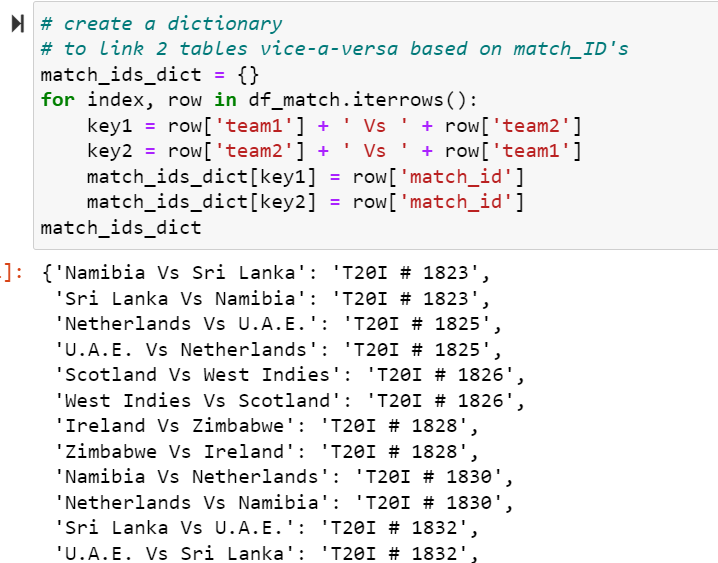
Dictionaries:
Python dictionary is an unordered collection of items. While other compound data types have only value as an element, a dictionary has a key: value pair. Dictionaries are optimized to retrieve values when the key is known. Creating a dictionary is as simple as placing items inside curly braces {} separated by comma. An item has a key and the corresponding value expressed as a pair, key: value. While values can be of any data type and can repeat, keys must be of immutable type (string, number or tuple with immutable elements) and must be unique.
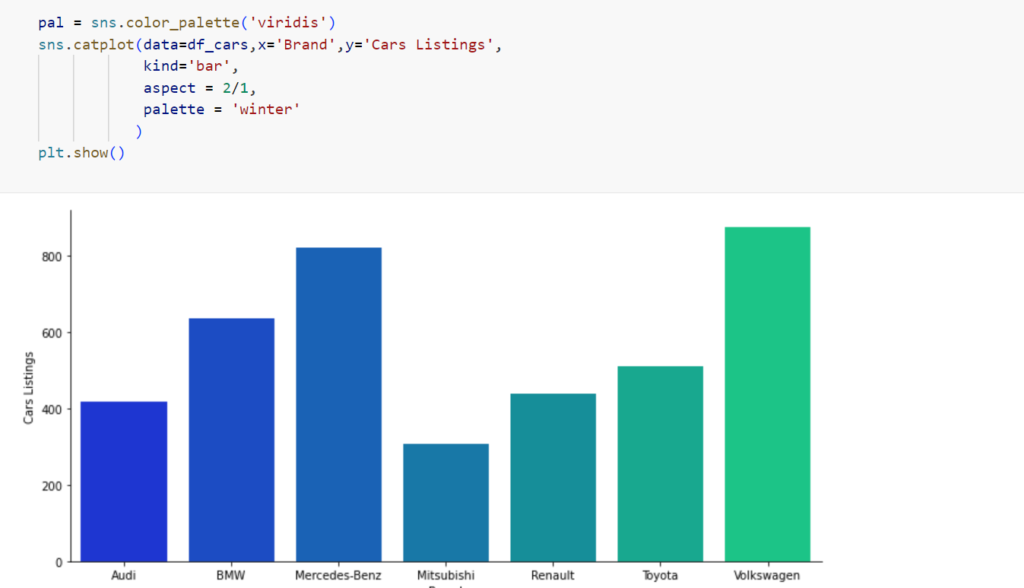
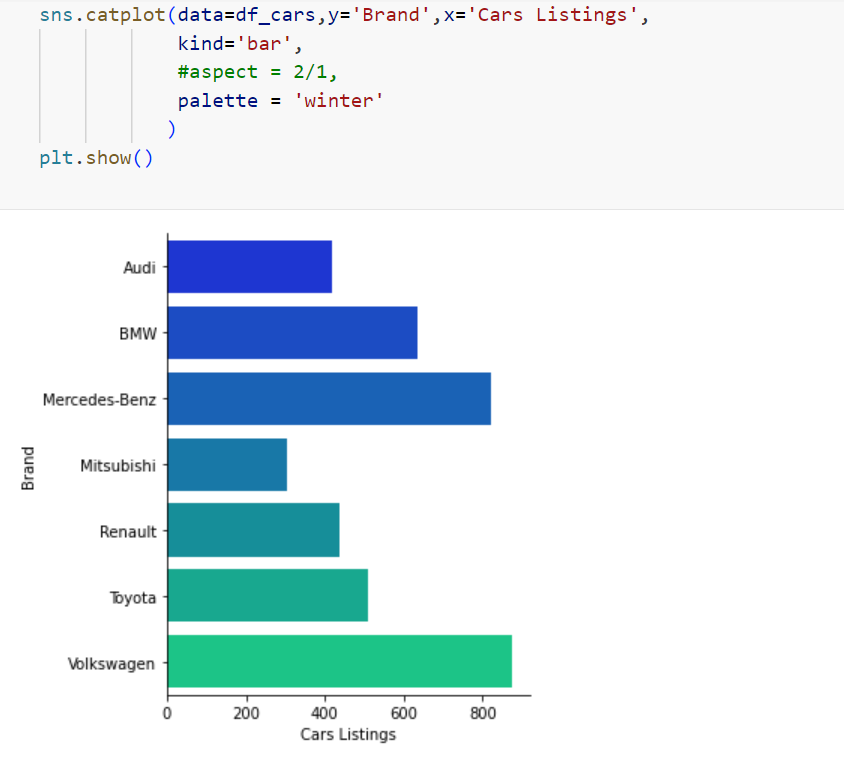
Matplotlib:
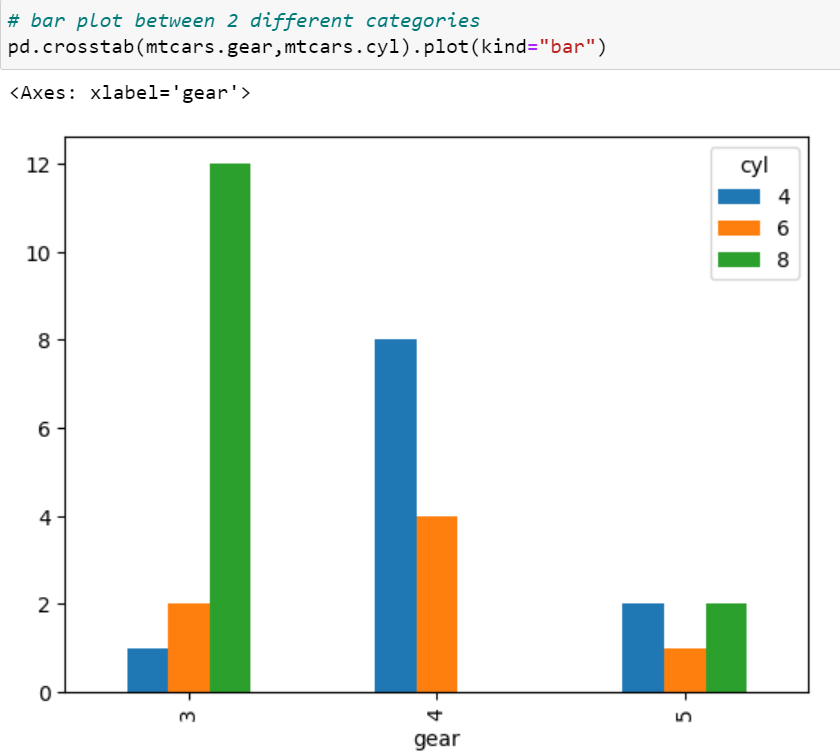
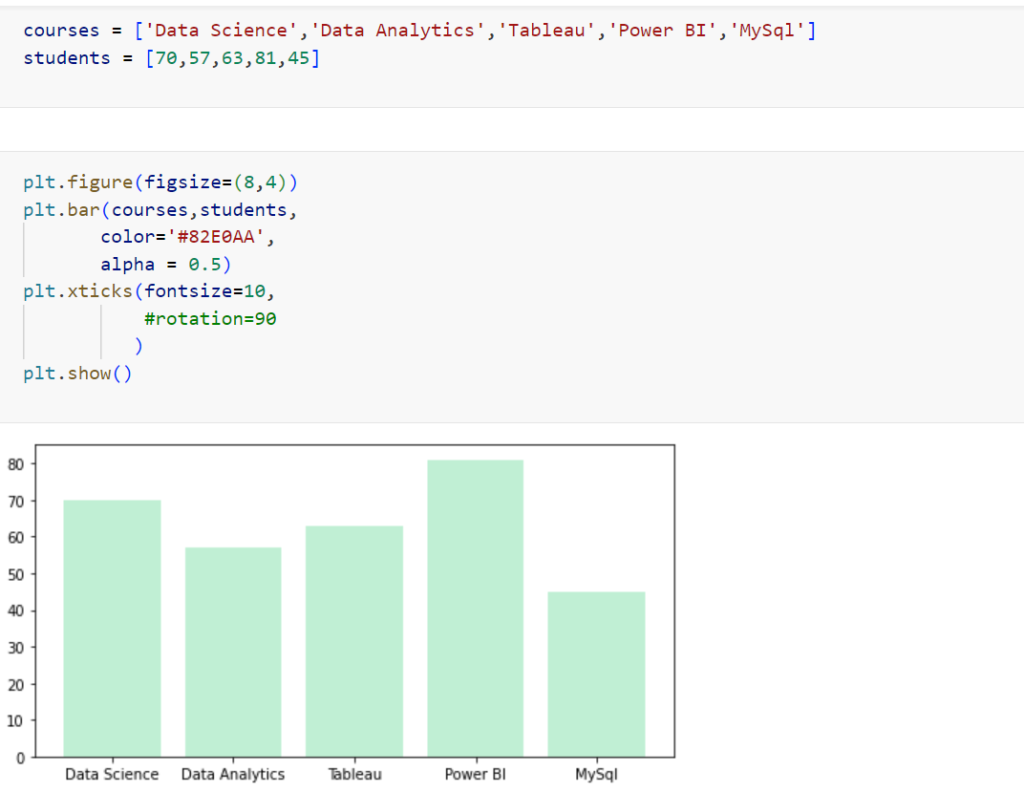
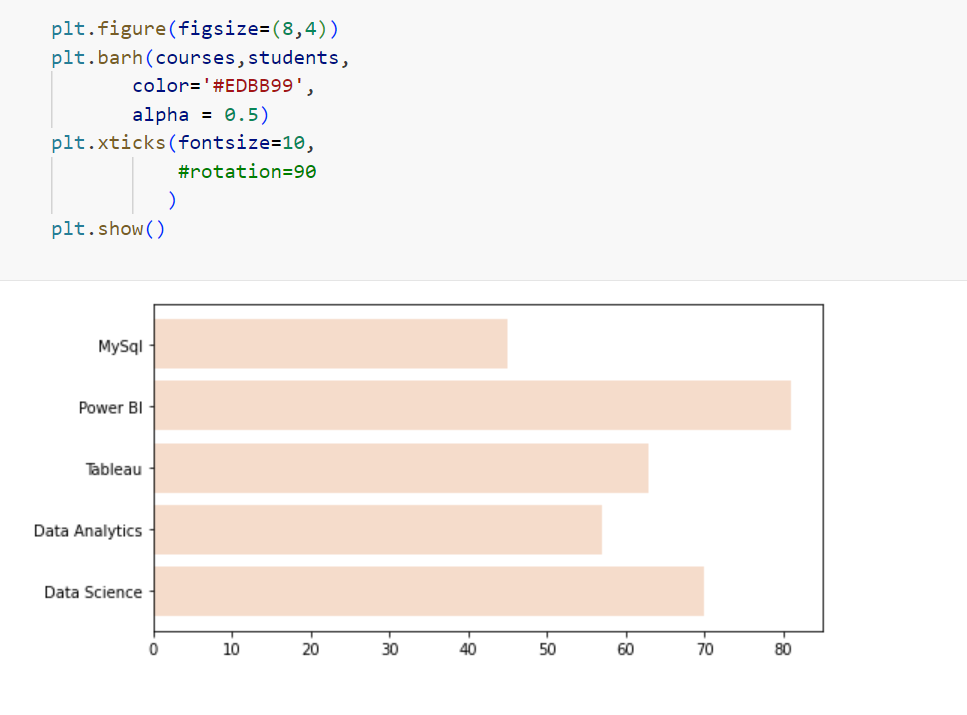
A bar plot is a way of representing data where the length of the bars represents the magnitude/size of the feature/variable. Bar graphs usually represent numerical and categorical variables grouped in intervals.
Let’s compare the number of cyl – # of cylinders with gear – # of gears in mtcars data dictionary dataset.
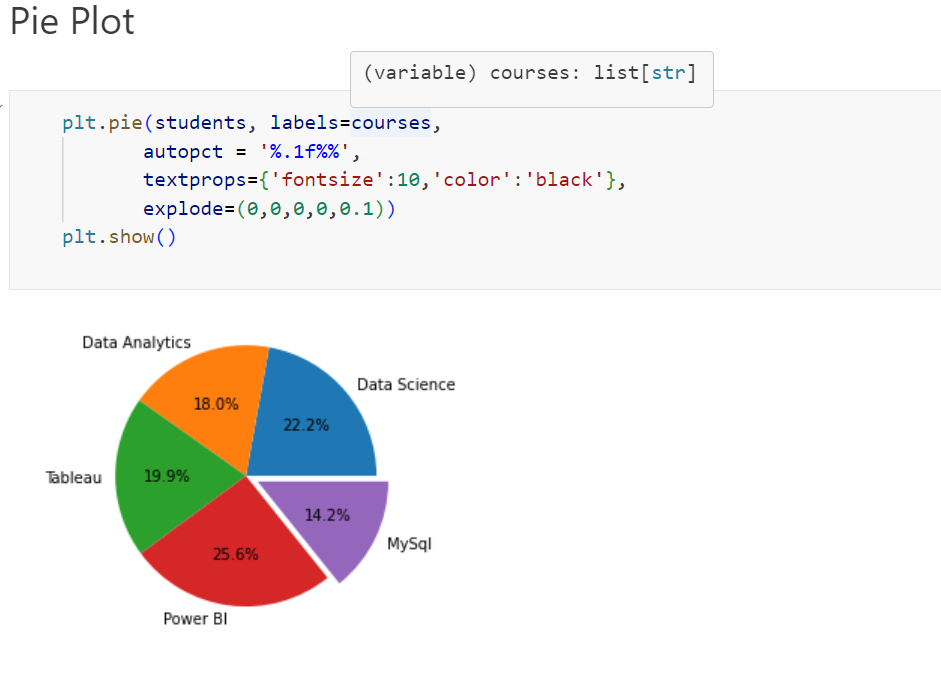
Pie-chart:
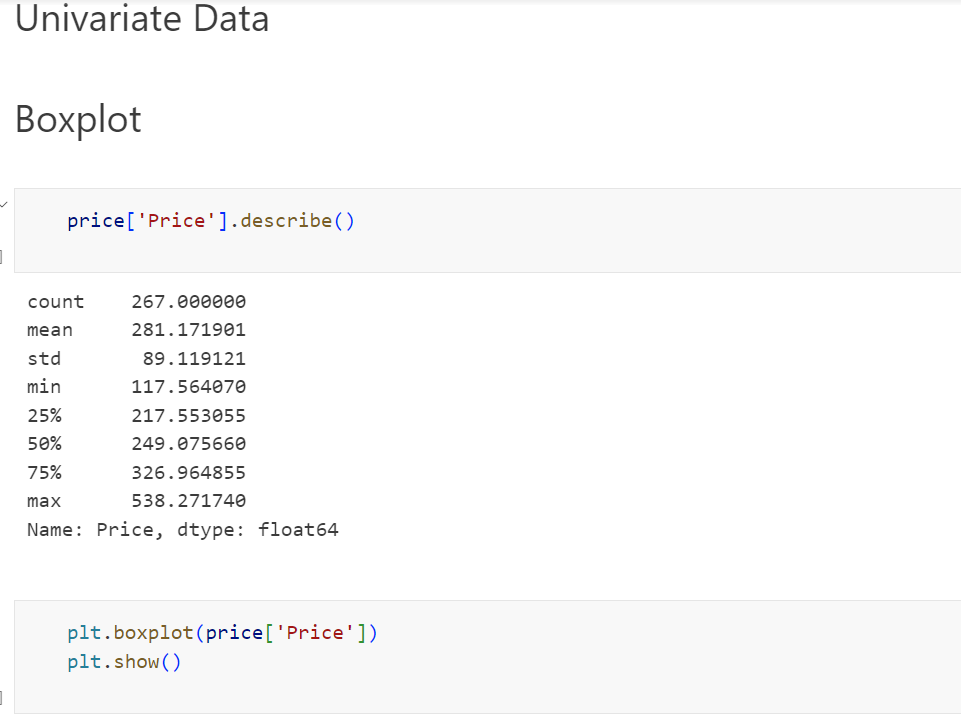
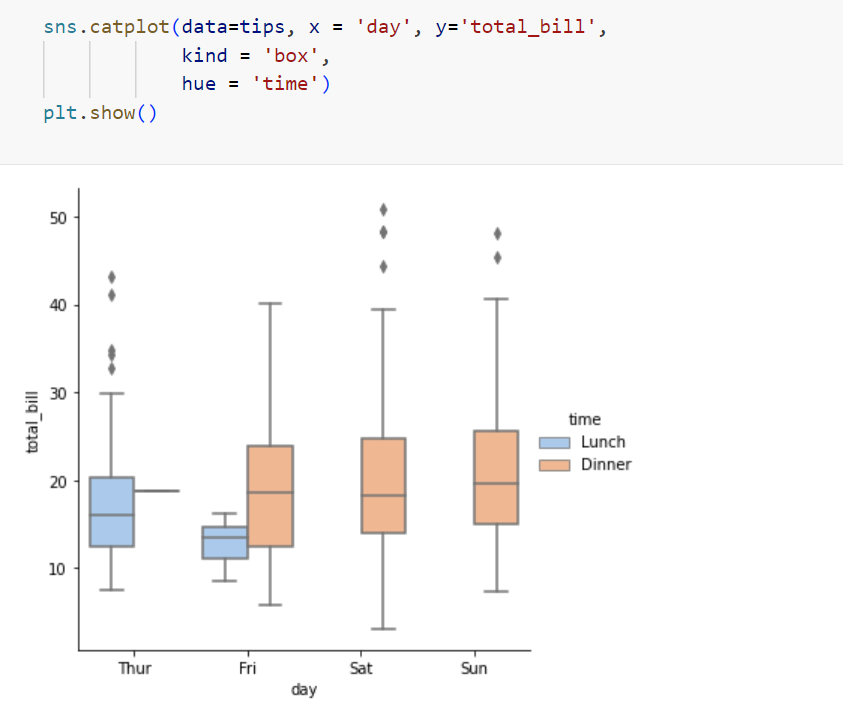
Box plot:
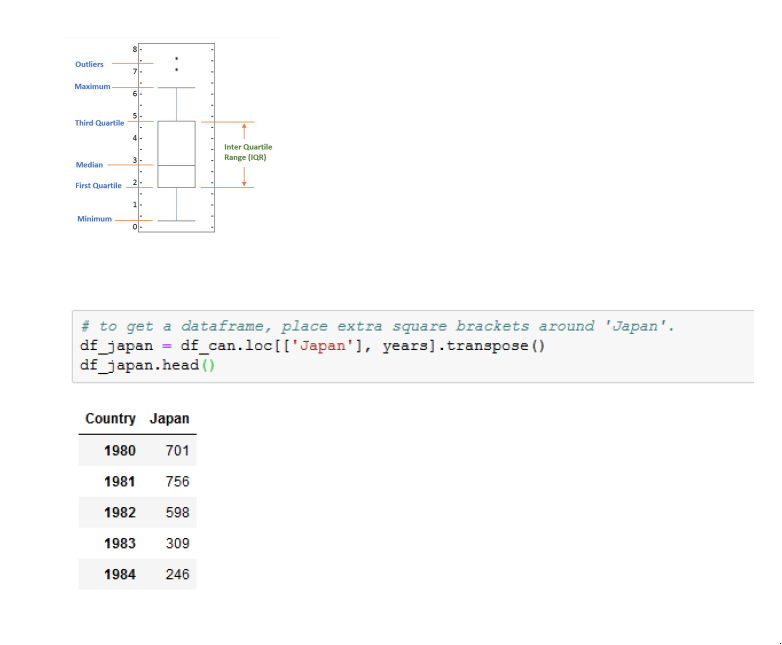
A box plot is a way of statistically representing the distribution of the data through five main dimensions :
Minimum: Smallest number in the dataset.
First quartile: Middle number between the minimum and the median.
Second quartile (Median): Middle number of the (sorted) dataset.
Third quartile: Middle number between median and maximum.
Maximum: Highest number in the dataset.
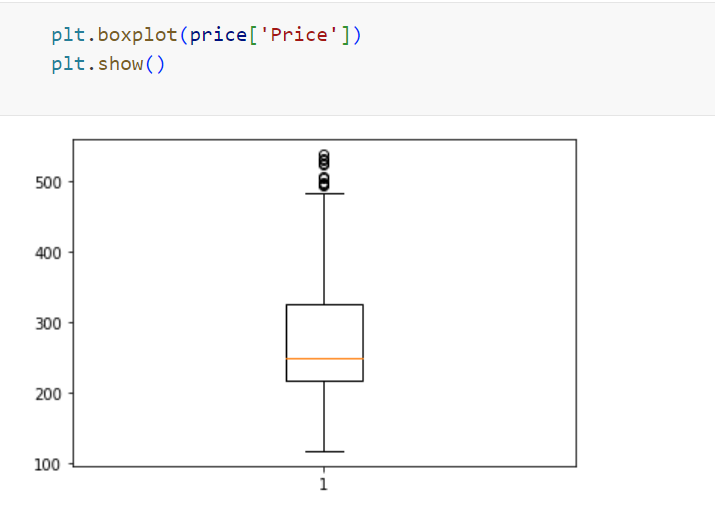
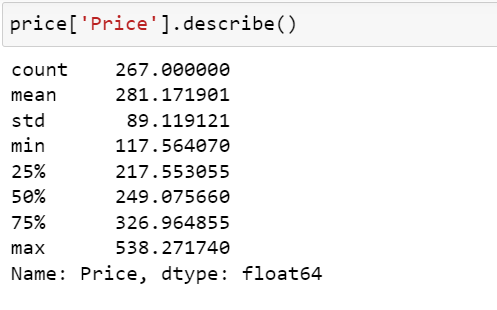
25% of the prices falls in the range of around 220, 75% of the prices falls in the range of around 350
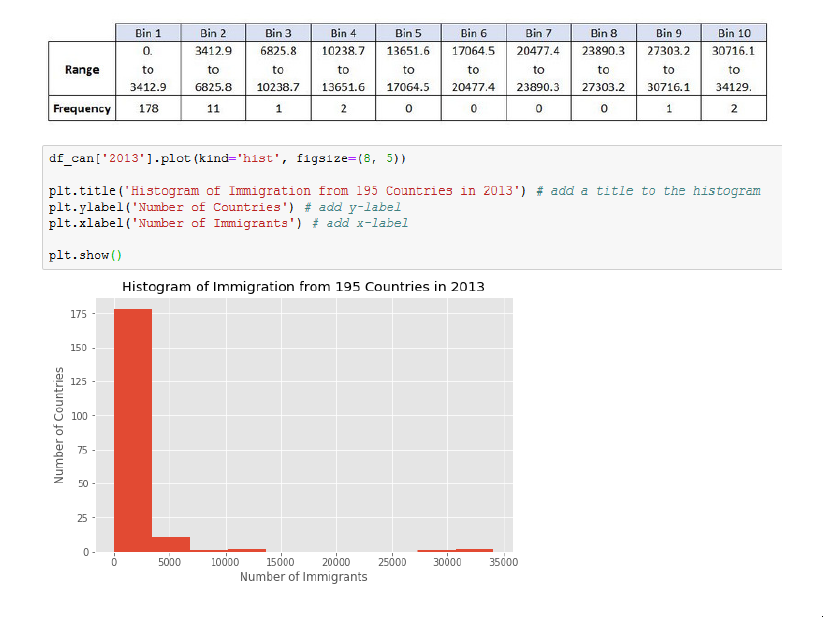
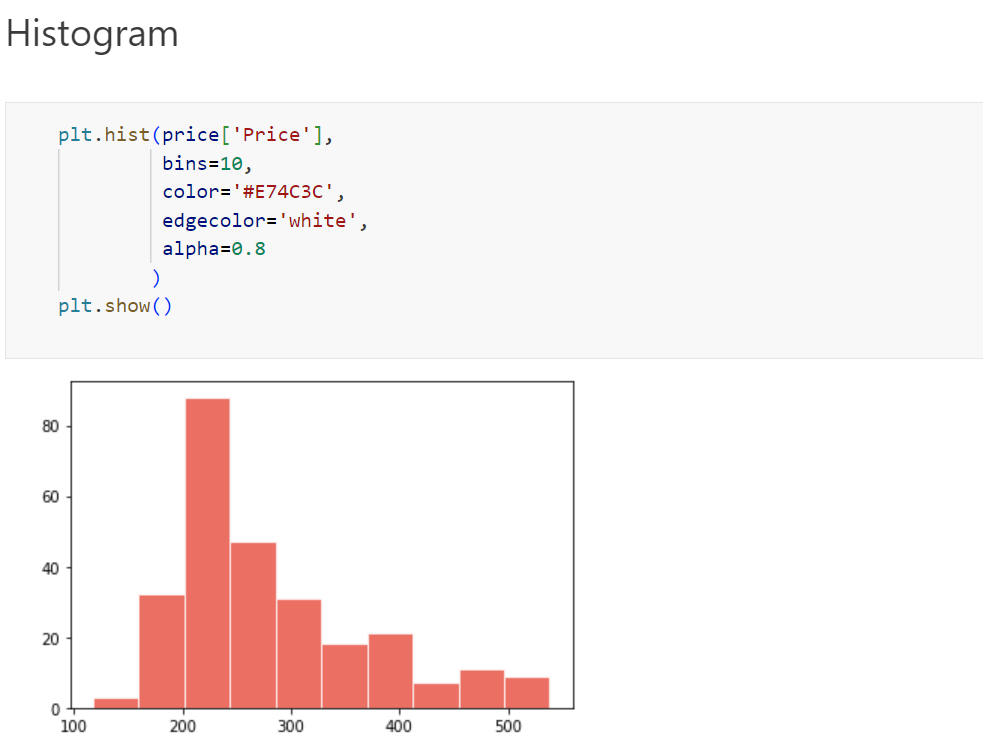
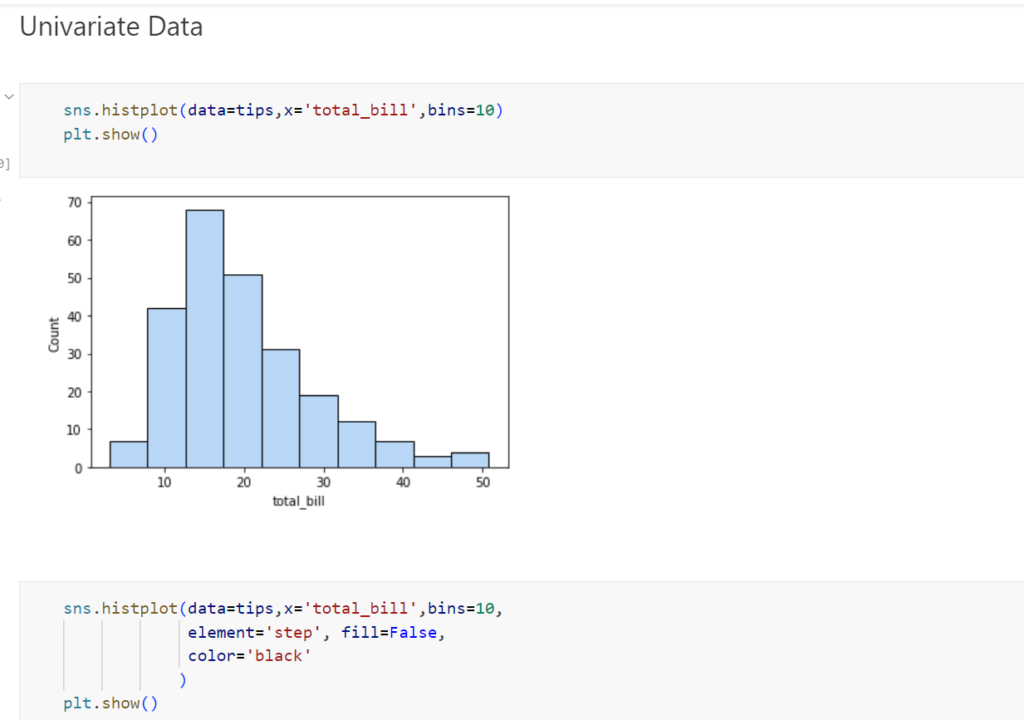
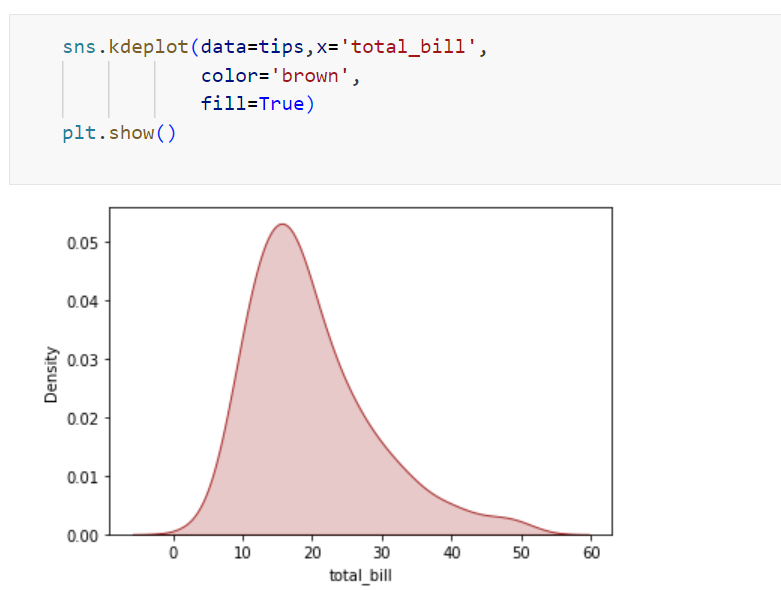
Histogram:
By default, the histogram method breaks up the dataset into 10 bins. The figure below summarizes the bin ranges and the frequency distribution
Probability Distribution:
Types of plotting:

Recent Comments