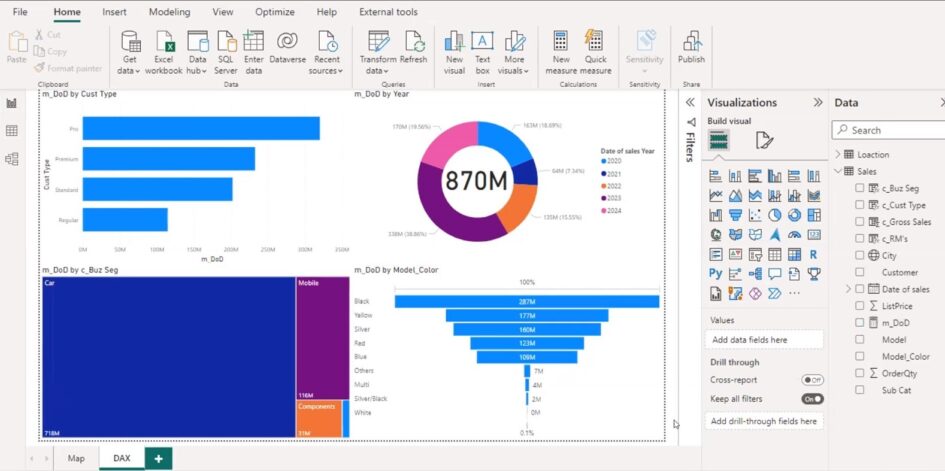

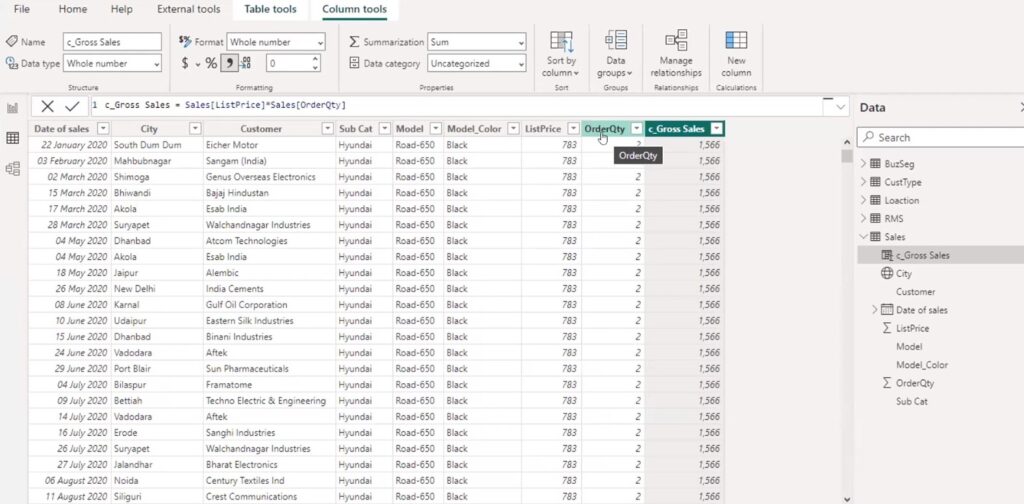
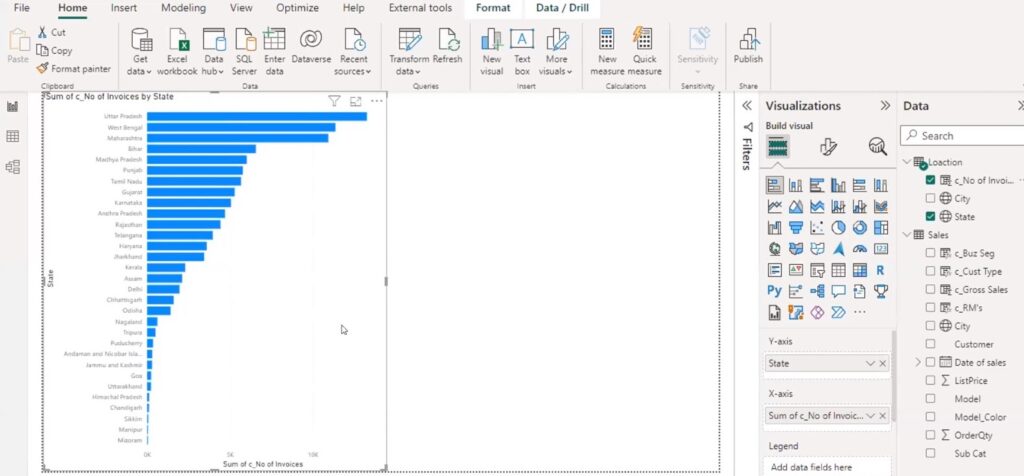
Introducing New measure of Columns:
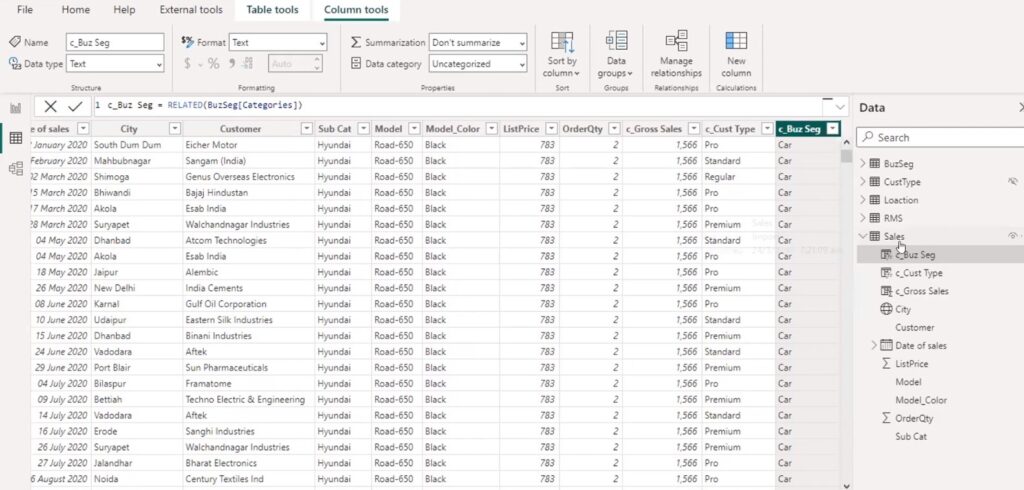
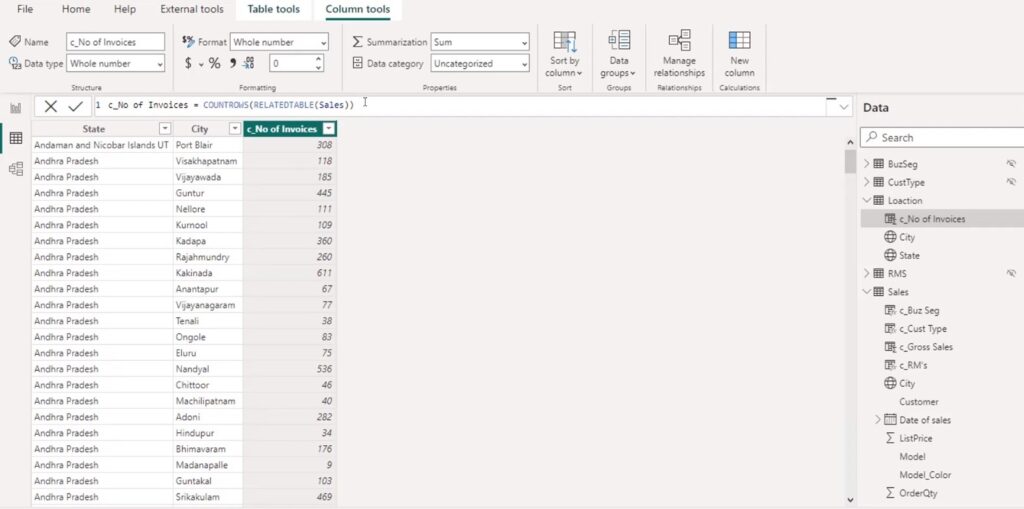
Related Vs RelatedTable Dax measure:
Related Dax to get a column of business segment
RelatedTable DAX measure gives count of each rows of city in location table.
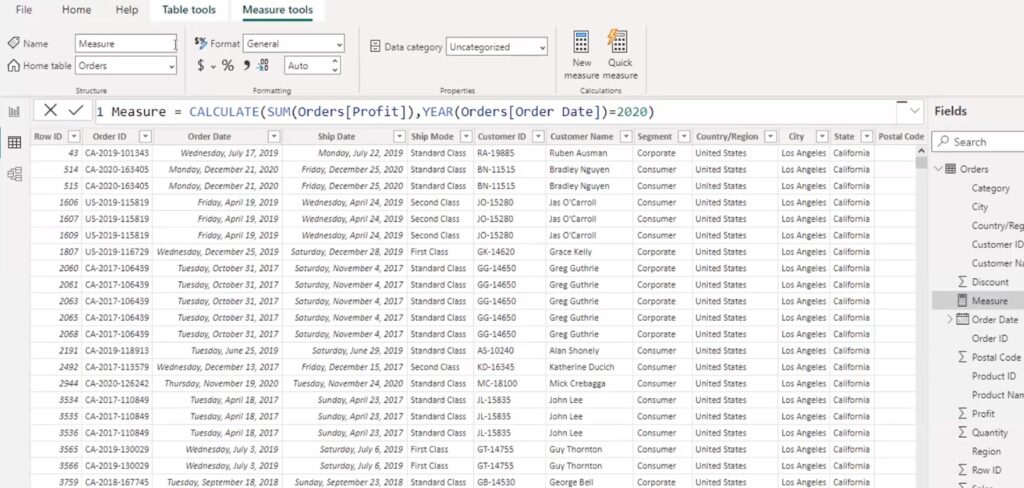
Using Filter function calculate for calculating sales of business segment ‘Mobile:
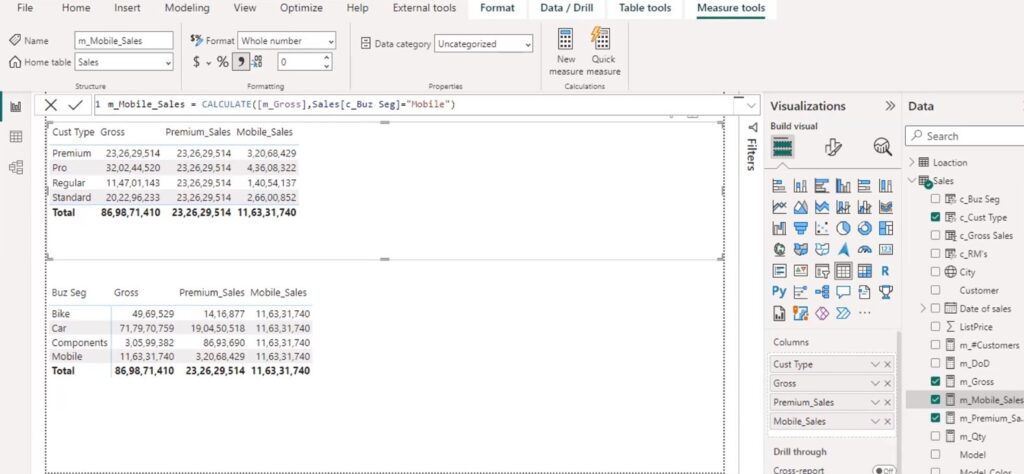
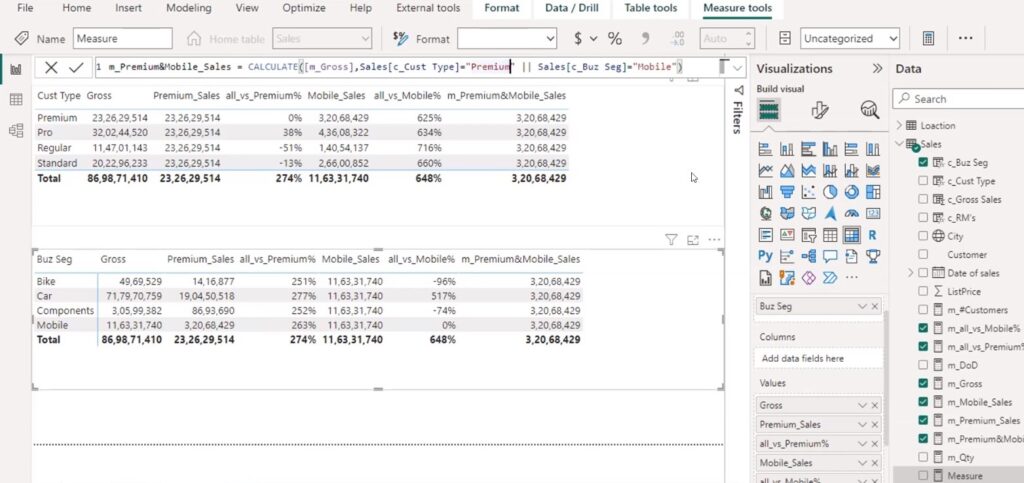
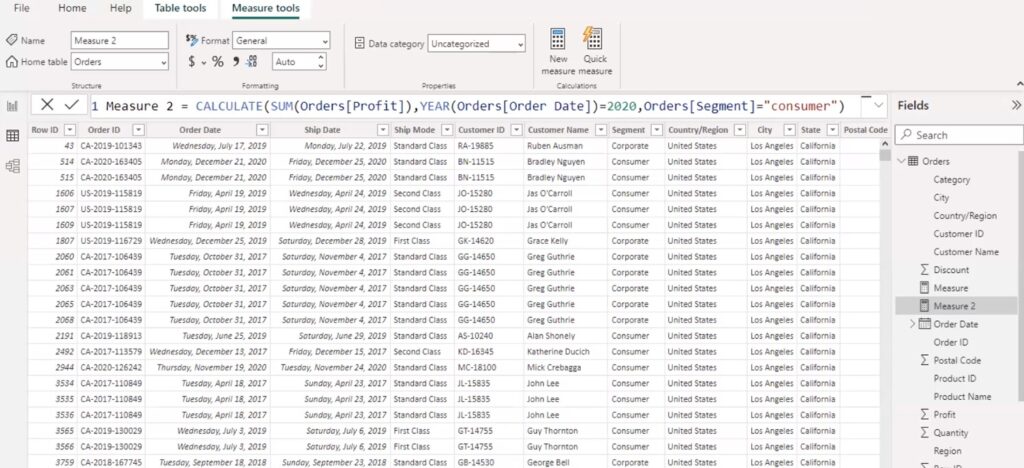
For business segment ‘Mobile’ and customer type ‘Premium’ sales:
SUMX DAX for calculating 2013 sales:
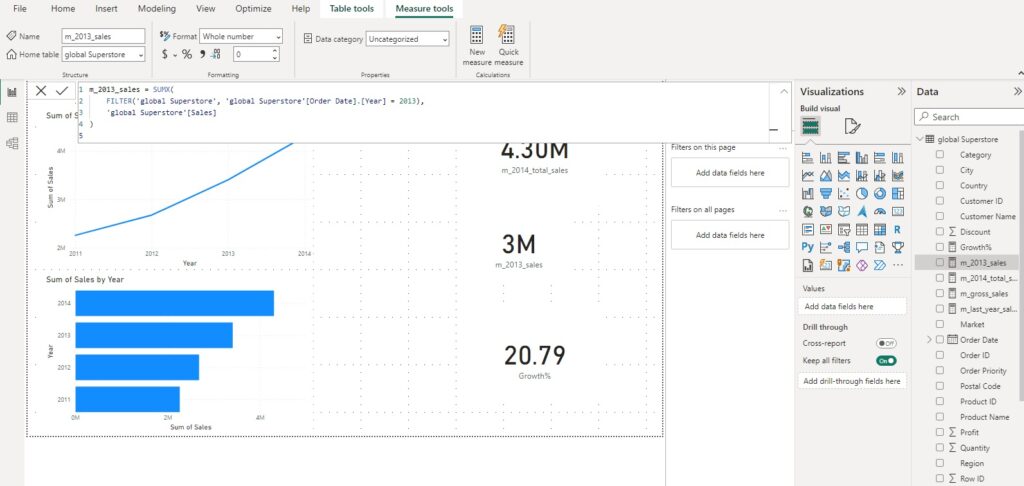
SUUMX = SUMX(Sales, Slaes[QTYNET]*Sales[Unit price]) which takes 2 arguments from table and expression
Inorder to filter an expression by a custom date range:
u_products = CALCULATE(DISTINCTCOUNT(Sales[c_Product]),DATESBETWEEN(DateTable[Date],BLANK(),BLANK()))
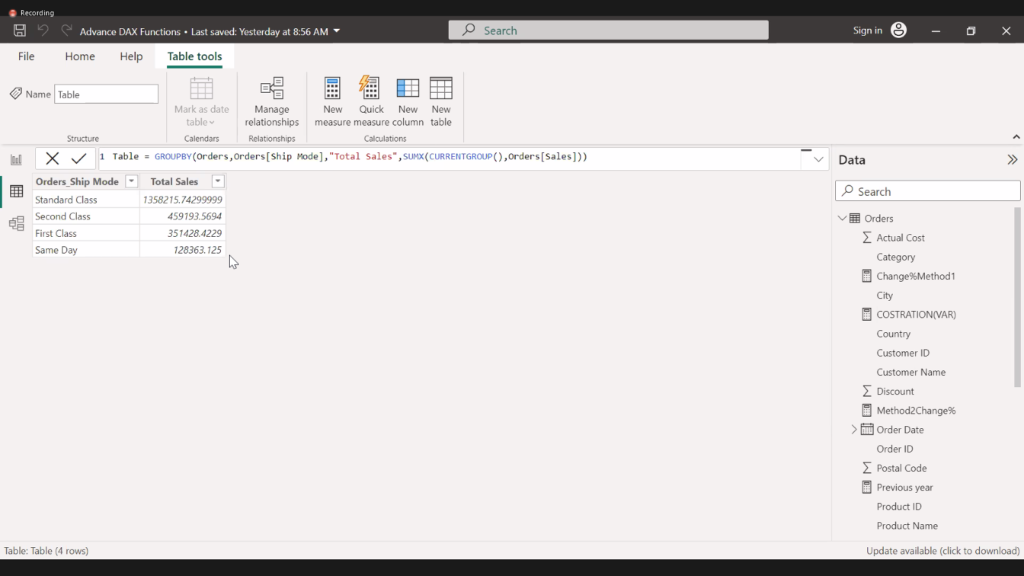
GroupBy Dax function:
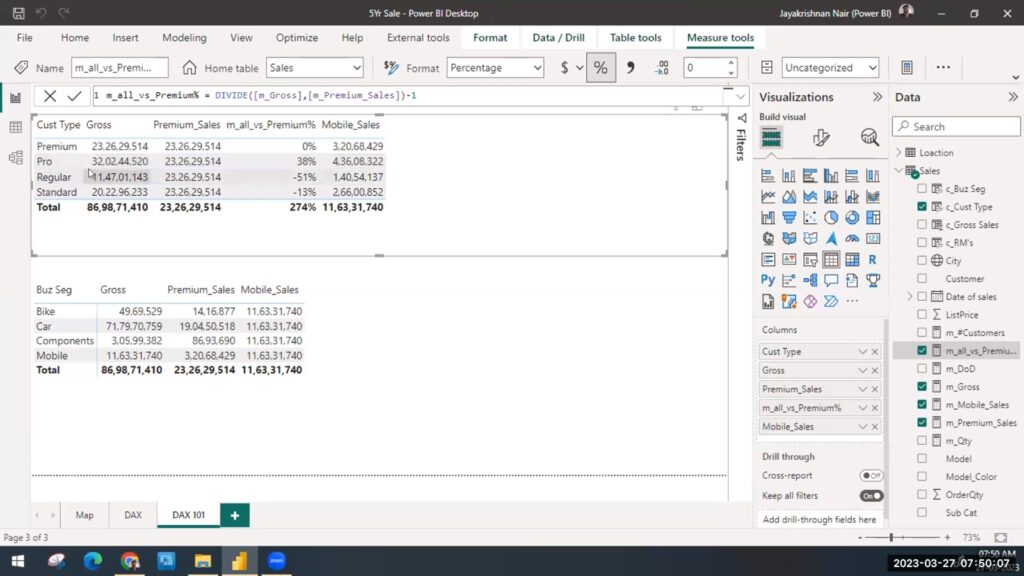
Divide DAX interms of %:
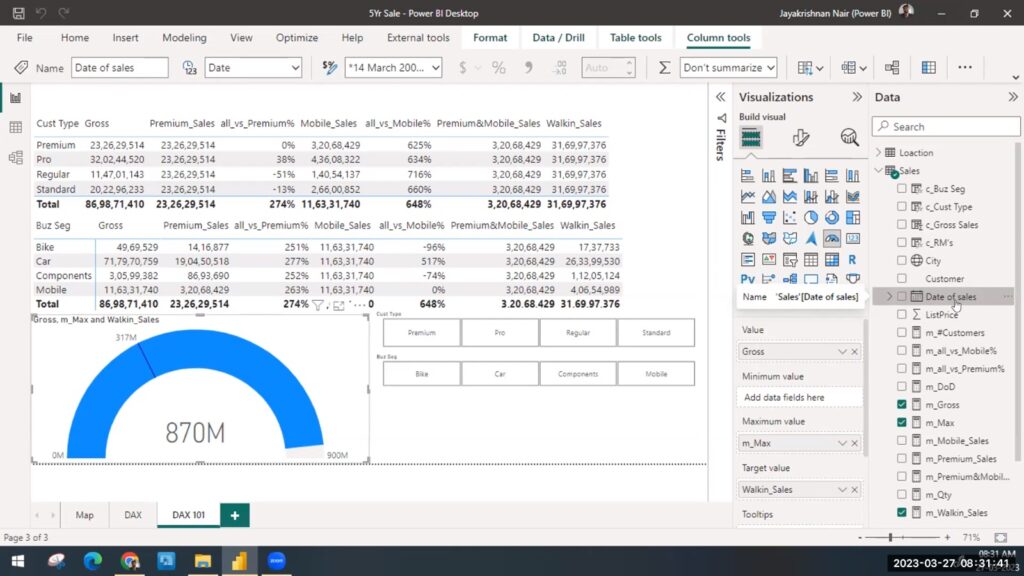
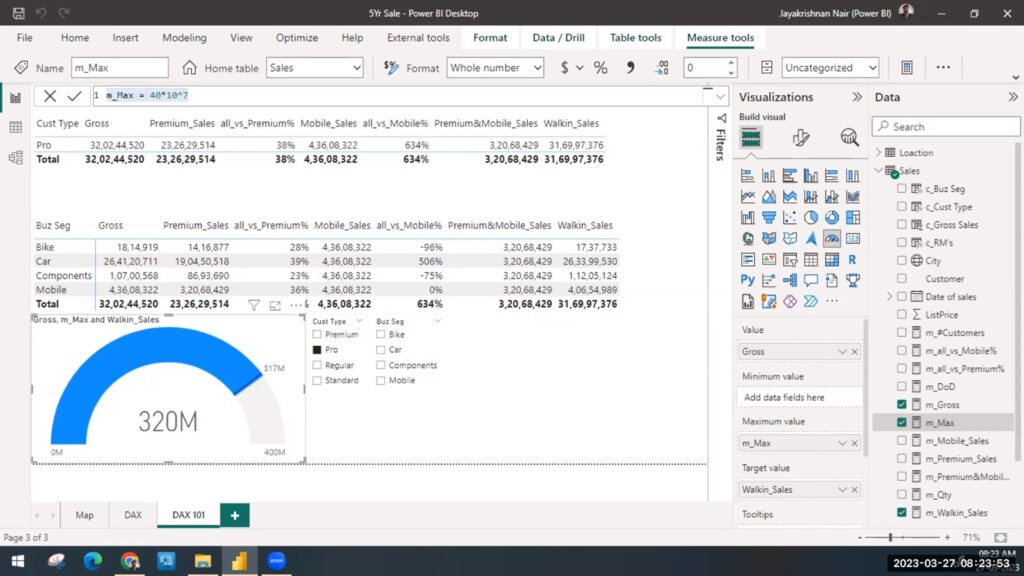
Gauge chart to track the target:
Time Intelligence Function:
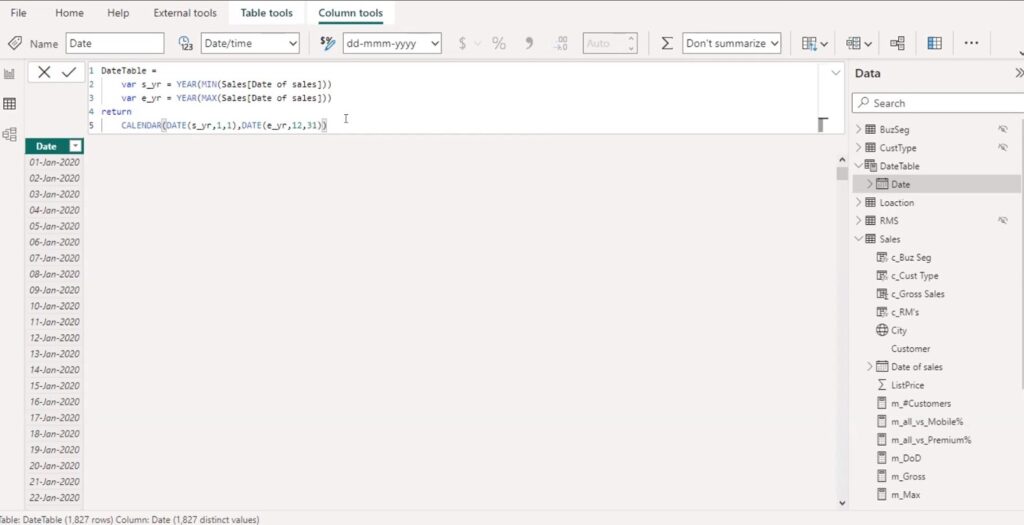
DateTable = CALENDAR(DATE(2020,3,1), DATE(2024,6,31))
Months = FORMAT(DateTable[Date],"MMMM")
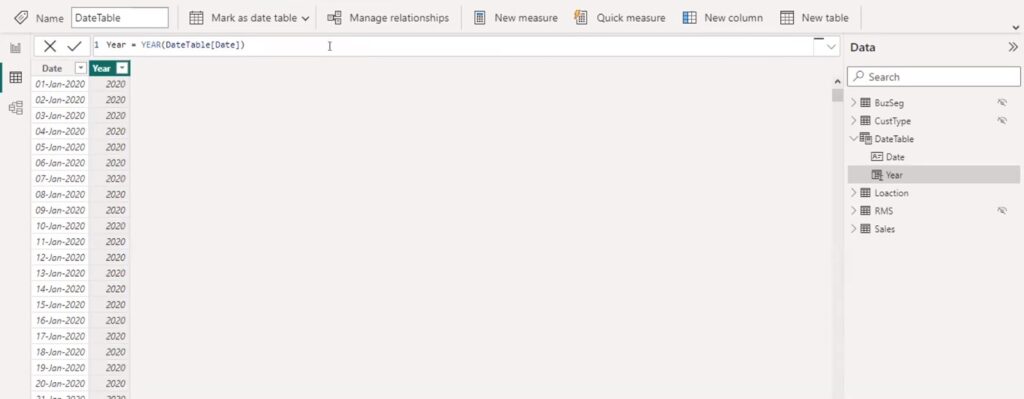
Year = YEAR(DateTable[Date])
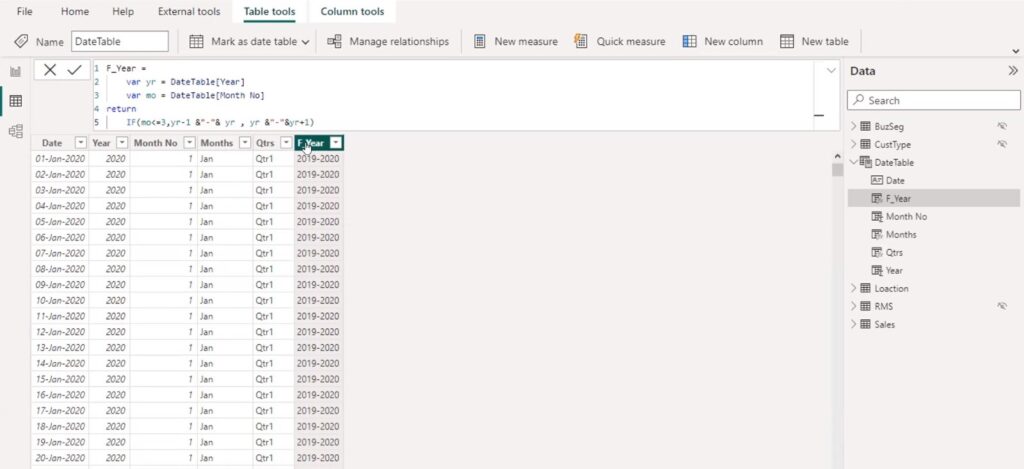
F_Year =
Var Yr = DateTable[Year]
Var mo = DateTable[Month No]
return
If(mo<=3, Yr-1 &"-"&Yr, Yr&"-"&Yr+1)
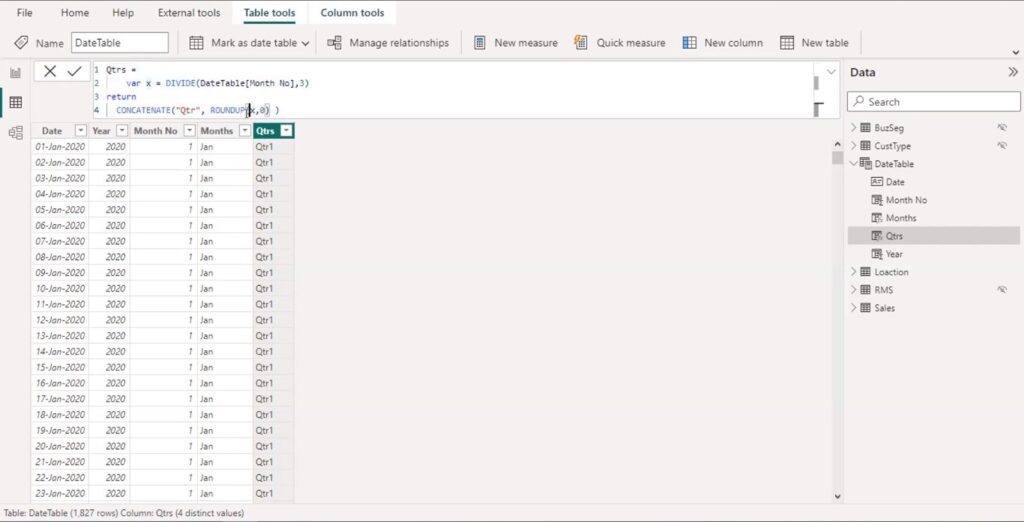
Qtrs =
Var x = DIVIDE(DateTable[Month No],3)
RETURN
CONCATENATE("Qtr", ROUNDUP(x,0))
or
Dates = ADDCOLUMNS(CALENDARAUTO(),
"YEAR", YEAR([Date]),
"Qtr", "Q"&QUARTER([Date]),
"Month",FORMAT([Date],"mmmm"),
"Month Number", MONTH(([Date])
))Quarter DAX:
Financial Year:
F_Year =
    Var Yr = DateTable[Year]
    Var mo = DateTable[Mth No]
return
    If(mo<=3, Yr-1 &"-"&Yr, Yr&"-"&Yr+1)
SamePeriodLastYear:
SamePeriodLastMonth:
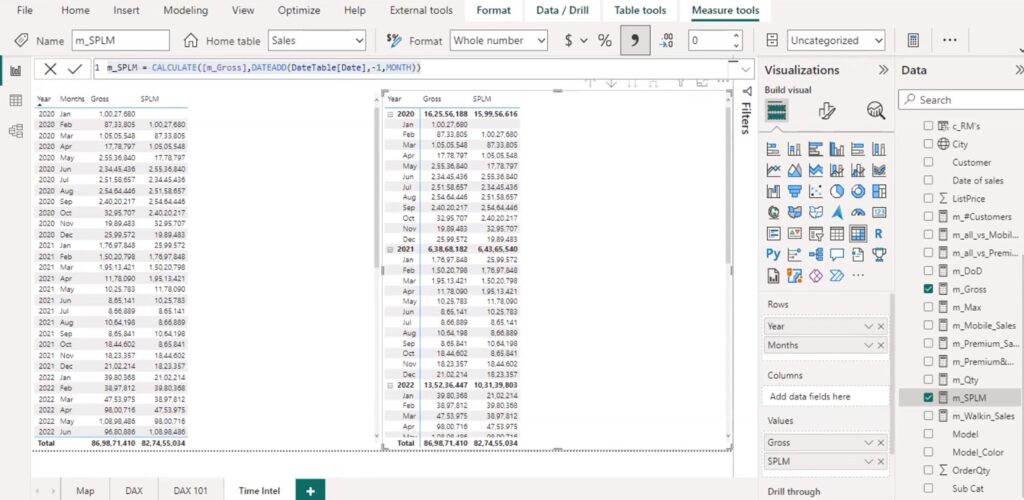
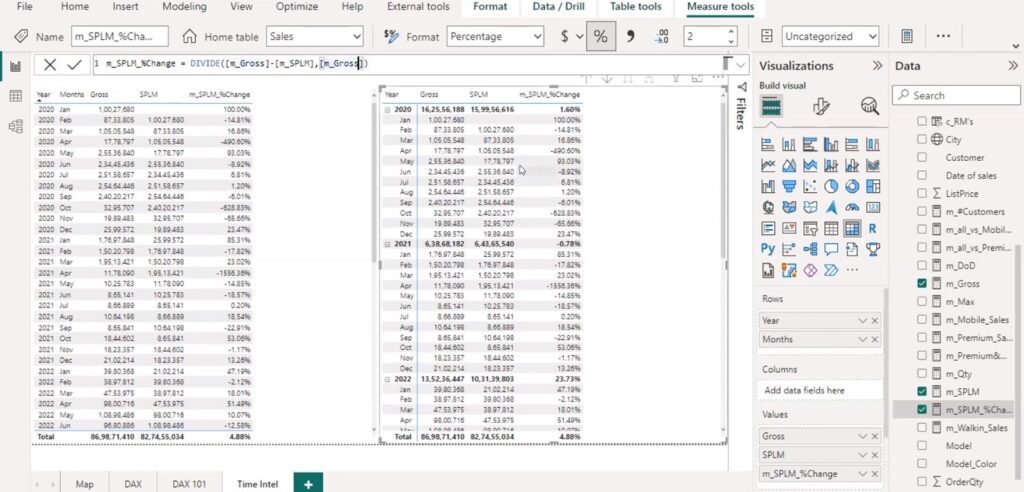
SPLM % change:
m_DoD = SUM(Sales[Revenue])
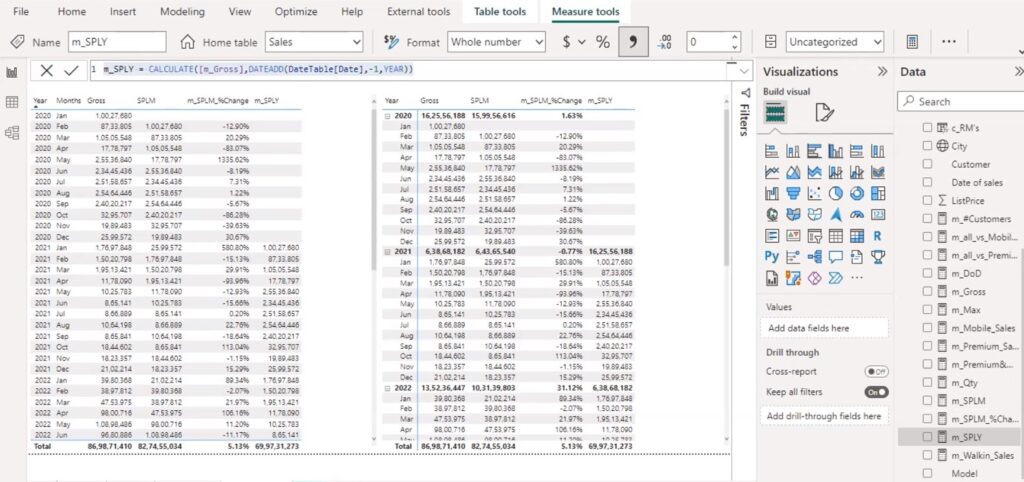
m_SPLM = calculate([m_DoD],DATEADD(DateTable[Date],-1,MONTH))
m_SPLM_%change = DIVIDE([m_DoD]-[m_SPLM],[m_DoD])Total YTD:
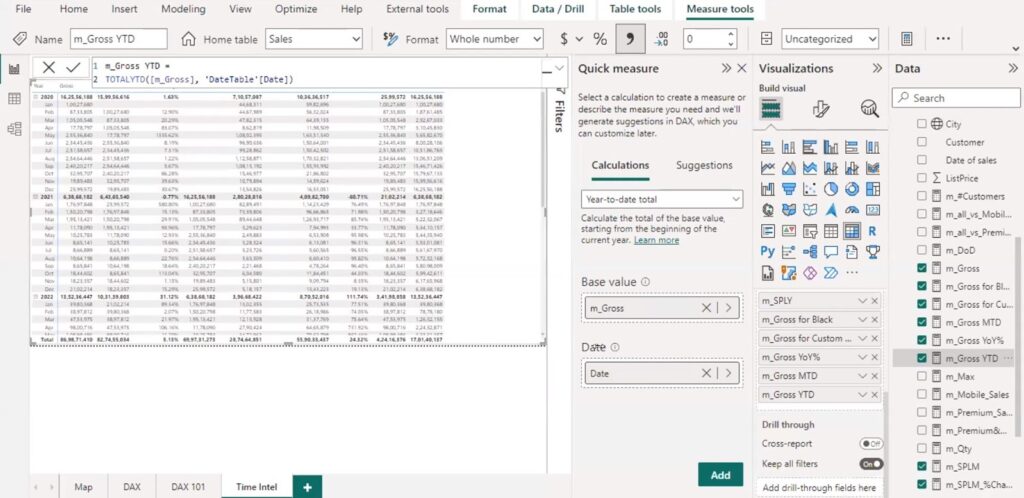
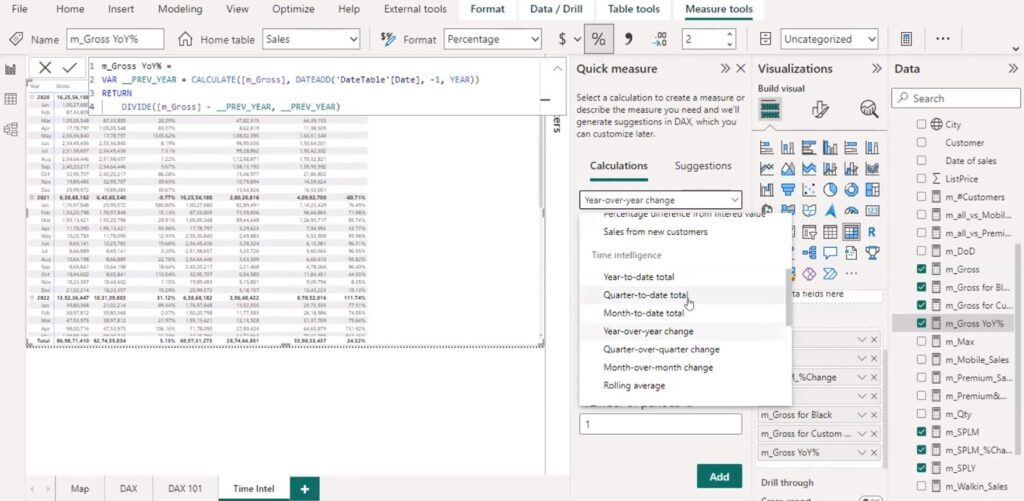
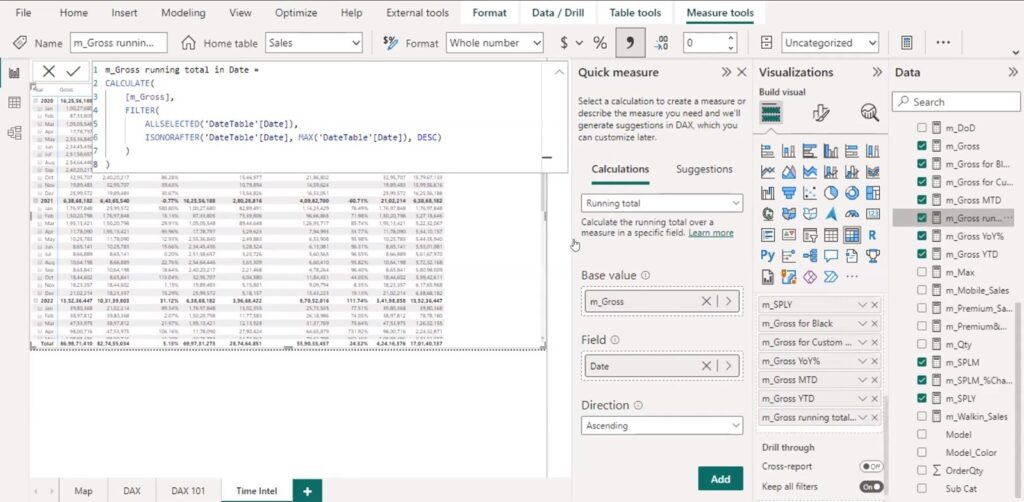
Quick Measures for calculating Running total and YoY%:
Recent Comments