Category Technology
Types of scatterplot: Markers for conditional formatting: Clusters in scatterplot: Clusters for country: Hidden relation: Visual bar chart: Creating combined axis chart: Ribbon chart: Scale to fit: Small Multiples:
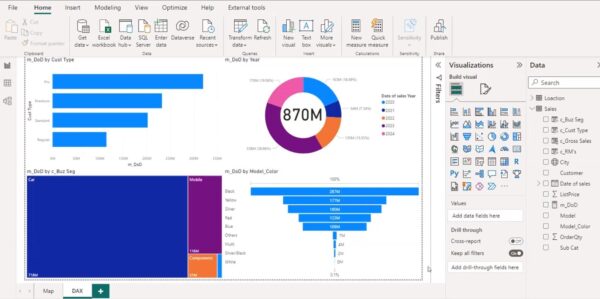
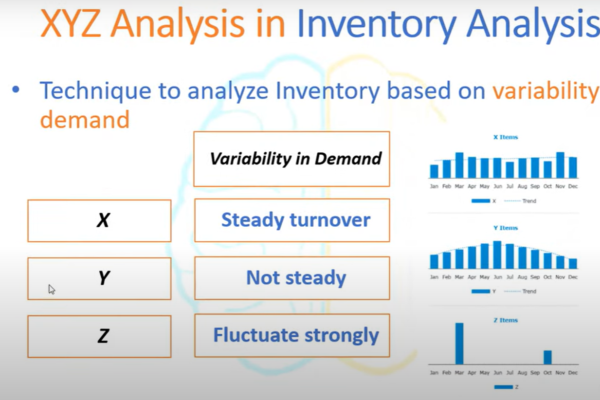
Power BI Inventory Management Dashboard: Supply Chain Analytics Modelling in PowerBI: General Calculation: Specific calculation: Revenue vs Revenue by orderDate: Power BI Inventory Management Dashboard: Power BI Inventory Management includes ABC Inventory Classification, XYZ Classification, Inventory Turnover Ratio, Calculation of… Continue Reading →
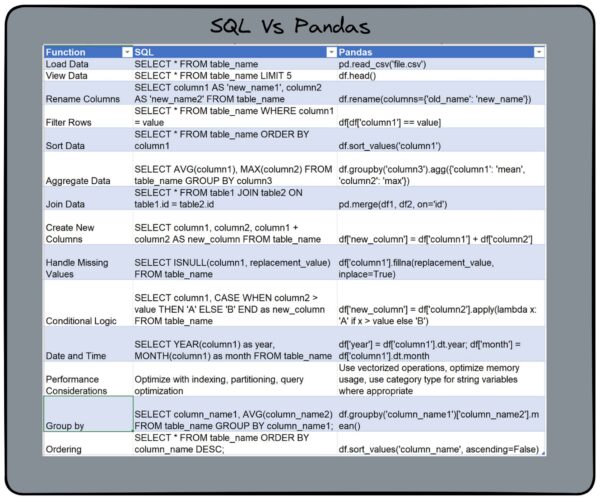
Descriptive statistics using pandas: These are the three steps we should perform to do statistical analysis on pandas dataframe. Collect the data: To do any statistical analysis, first collection of data is the important task We can store the collected… Continue Reading →
Dashboard-2: Get data from Excel to the database: DAX query to highlight highest: Power query to extract Max and min date: Dax measure: Monthly Disbursement for last month: Portfolio at risk: Invalid loans report: Grouping the table based on a… Continue Reading →
KPI’s as DAX measures for winning measures: CALCULATE used to calculate the number of matches.COUNTROWS counts the number of rows essentially counting the total number of matches in the dataset.a condition or filter is applied to checks if the “toss_winner”… Continue Reading →
Practice: Current Year sales: Previous Year Sales: Formatting profitablity: Steps building Dashboard: 1.First adjust dashboard size as per your requirement2.Ensure Floating selected and drag vertical container, Go to Layout and adjust its x,y and Height and Width3.Click on Tiled, Add… Continue Reading →
For primary key and Unique key in a table, index is created automatically. Using indexes appropriately can significantly improve query efficiency for large tables and sorting/grouping operations. Create indexes to increase the performance of query. Like tableau’s context filter that… Continue Reading →
Creating triggers: Before insert trigger: To Create before insert trigger to make sure any new value of Working hours, if it is negative, then it should be inserted as positive. — Create the table create table emp_bit(name varchar(55),occupation varchar (100),working_date… Continue Reading →
