Category Technology
Understanding Cardinality: In our data, we have a relationship between country table and sample table using the country field. The country table in the first model have unique values for the respective fields. However, sample table have each value repeating… Continue Reading →
Power Query Editor is a data transformation and cleansing available in power BI. Performing data transformations: Split the columns into seperate columns based on delimiter Unpivot columns: Unpivoted Columns: Replace Value: String data cleaning: Age calculation: Adding conditional column: By… Continue Reading →
Dashboard: Dax expression: Slicer:To exclude row by row in slicer France Sales = calculate(sum(Sales_data[Sales Amount]), ‘Sales Territory_data'[Country] = “France”, ALL(Sales_data)) Non_france aus sales = CALCULATE(SUM(‘Sales_data'[Sales Amount]), … Continue Reading →
Creating a master data by DAX: Excel.Workbook([Content], true) Scatter and bubble charts: A scatter chart shows the relationship between two numerical values. Conditional formatting: Not summarised: Clustering: In PowerBI, clustering is used to create a new column in a dataset… Continue Reading →
From SQL to tableau: Joins: Inorder to unions or append or consolidate the data: Condition: Note: If the headers are different Appending data from multiple files tableau gives you path and sheet – as autogenerated fields Regex: Path and sheet… Continue Reading →
A parameter is workbook(Scope) variable of string,date,number data type, it is used to replace constant value in Calculation,Filter & Reference line Below are the Steps to Create a Paramter 1. Create a Paramter of any data type 2. Show Paramter… Continue Reading →
Donut chart: Step:2 Step:3 Step:4 Step:5 Step:6 Step:7 What is the difference between dual axis and blended axis: Blended axis Or Combined axis or Shared Axis chart-All are the same A shared axis chart in Tableau is that shares one… Continue Reading →
Getting started: Load sample financial dataset: Transform data: Web scrapping for World Happiness Report: Previewing to Select data: Tagging geo location: Creating visual Map: GDP per capita in Bubble size: Creating hierarchy for countries: Power query editor: Create relation: Continent… Continue Reading →
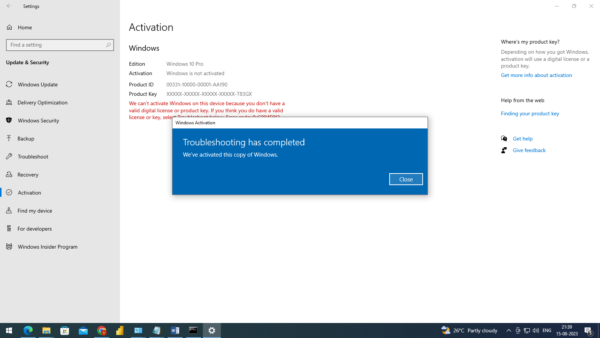
Common encountered problem: Turning off windows defender is key: Method-1:group policy editor config Method-2 Disabling windows defender: Method-3: Switching off windows defender by a tool called dControl Article Overview: Steps to follow: Step-1:Download 2 files in zip format and extract… Continue Reading →
Step-1: In this stored procedure, we declare a cursor variable cur that retrieves the names and marks columns from the marks table. Step-2: We also declare variables input_name, input_marks, to store the values fetched from the cursor Step-3: Inside the… Continue Reading →

