Creating a master data by DAX:
Excel.Workbook([Content], true)
Scatter and bubble charts:
A scatter chart shows the relationship between two numerical values.
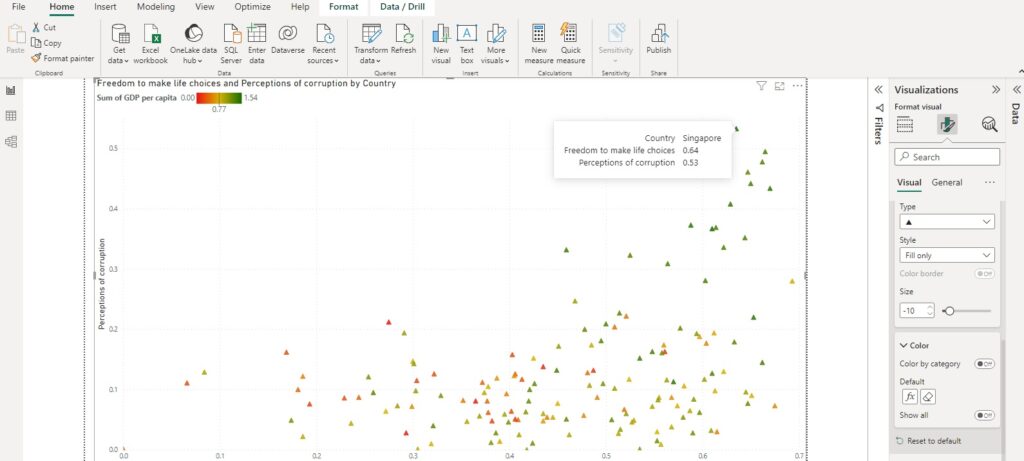
Conditional formatting:

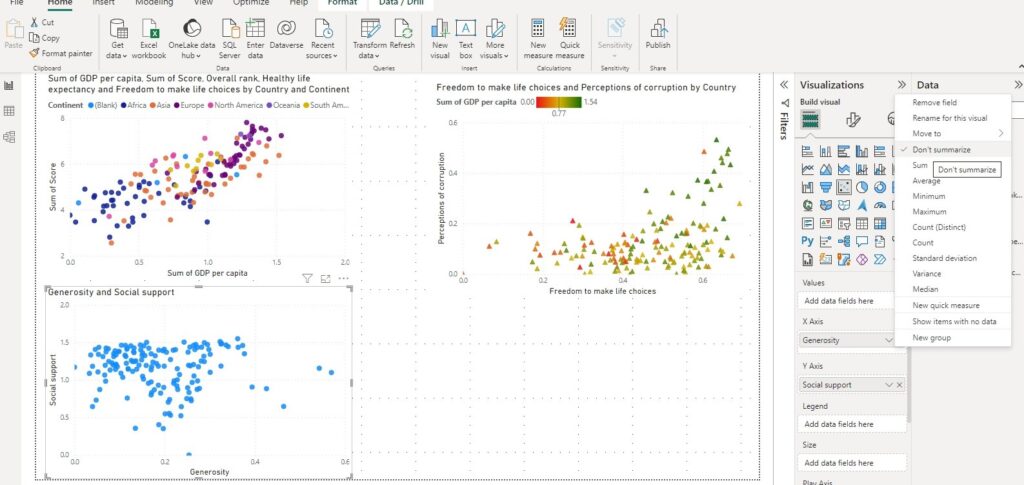
Not summarised:
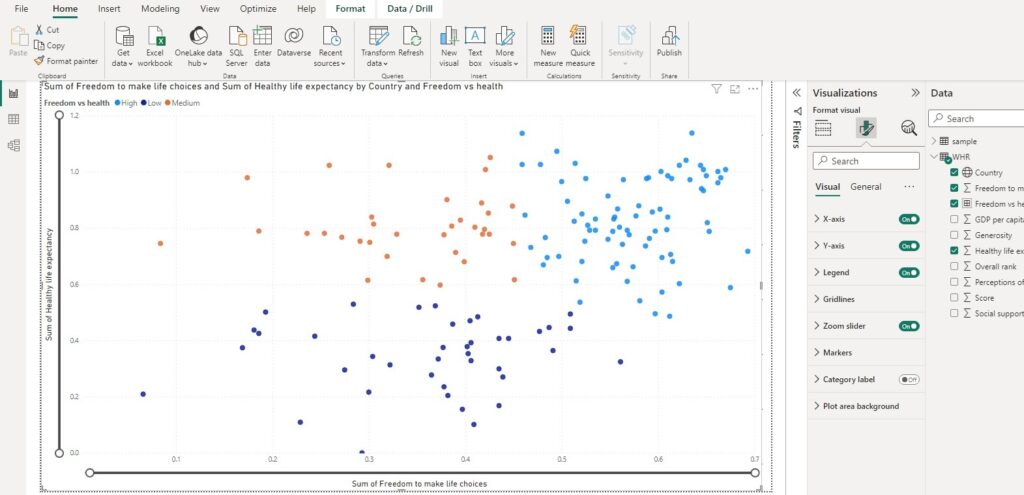
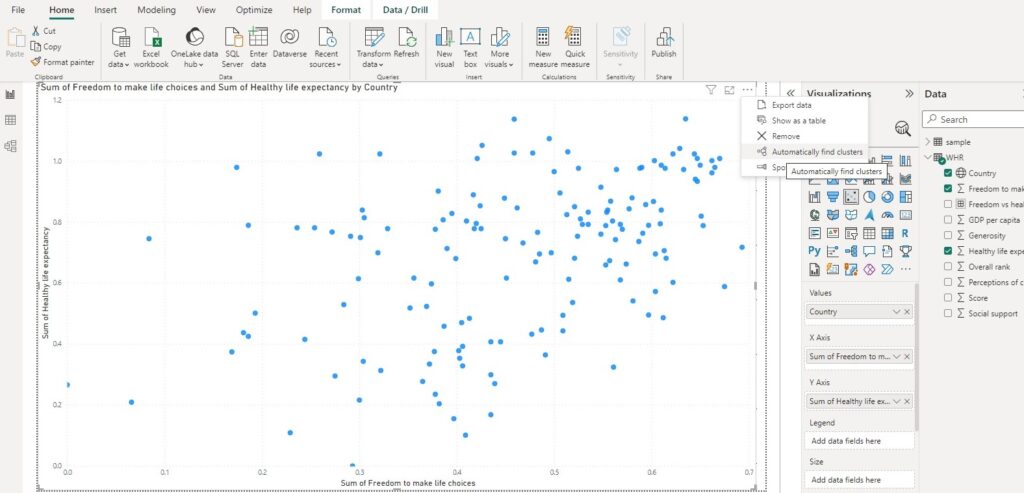
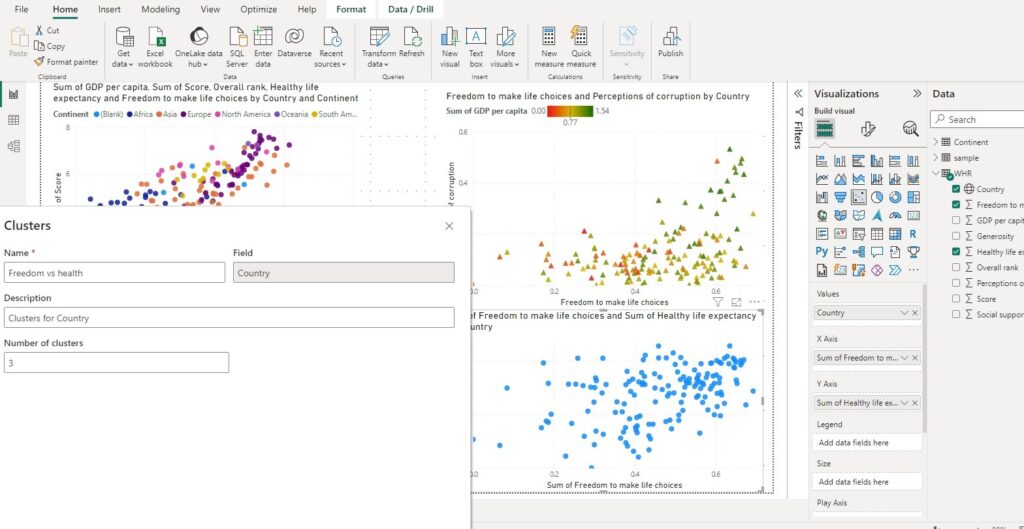
Clustering:
In PowerBI, clustering is used to create a new column in a dataset that groups similar data points based on their similarities.
Automatically find clusters for table and scatter plot visuals.
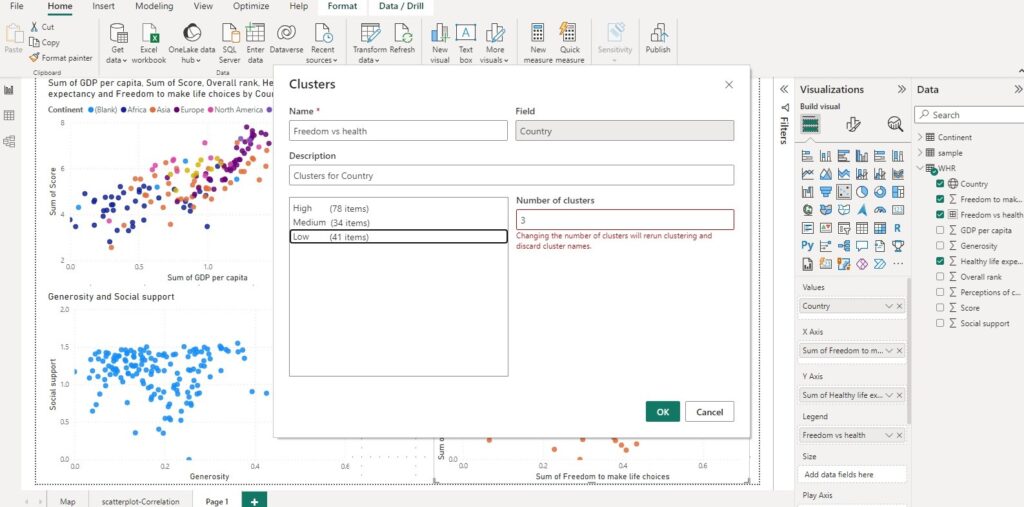
Create clustered column:
Clustering parameters:
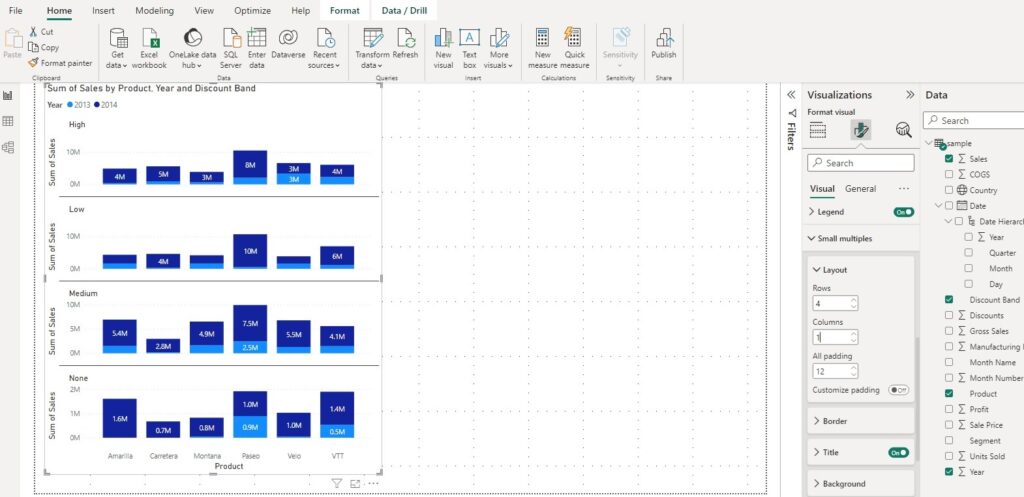
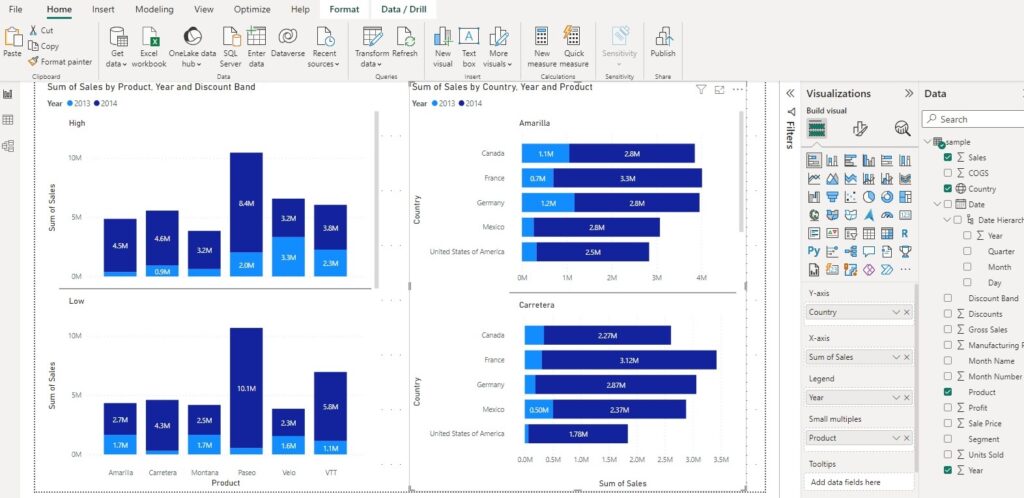
Bar chart:
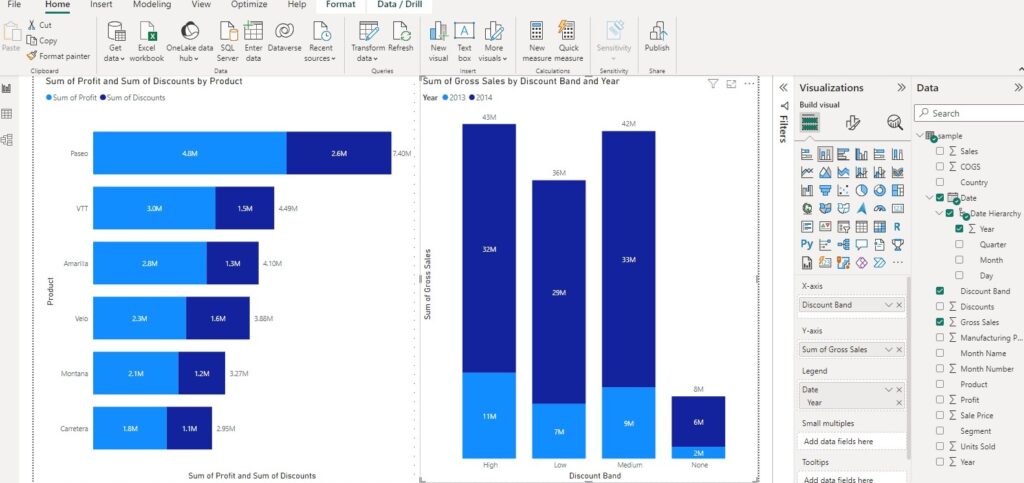
Bar charts for comparison:
Understanding Timelines:
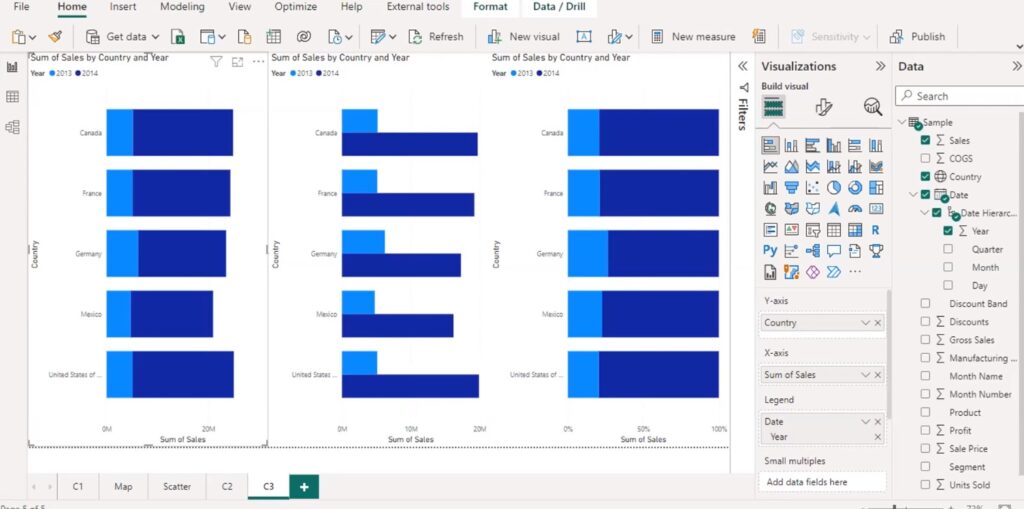
Combined axis charts:
Combining two charts into one lets quicker comparison of data.
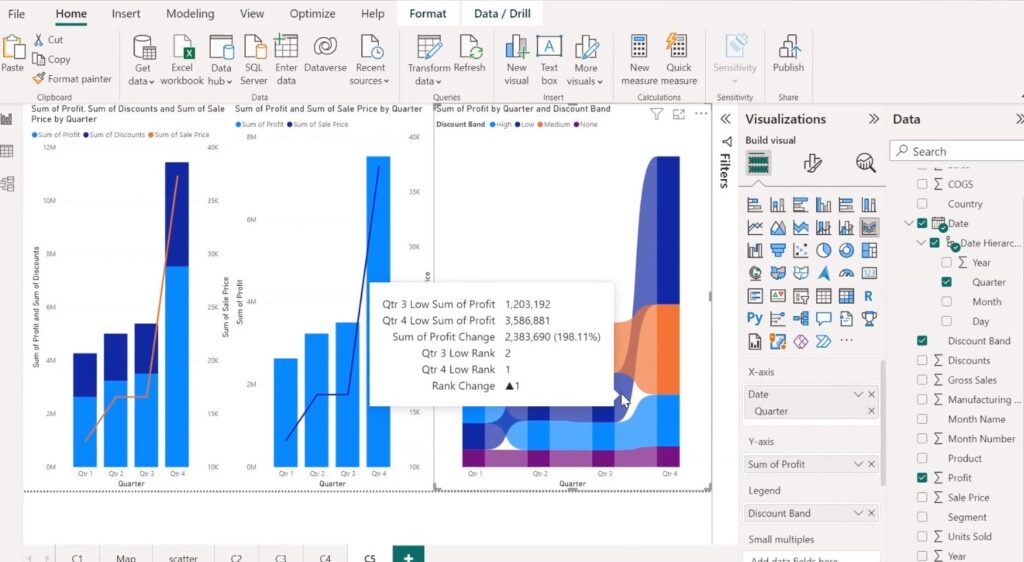
Ribbon chart shows which data category has the highest rank (largest value). Ribbon charts are effective at showing rank change, with the highest range (value)always displayed on top for each time period.
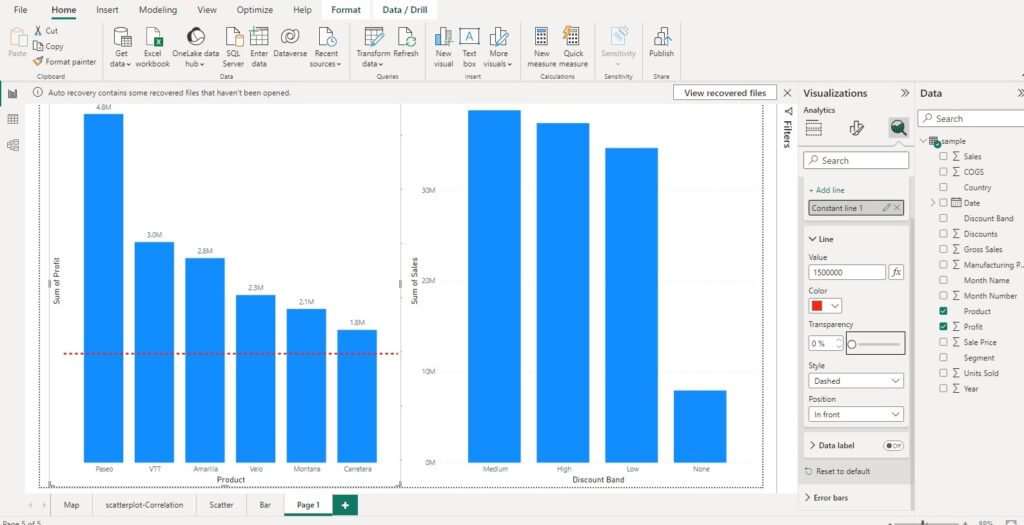
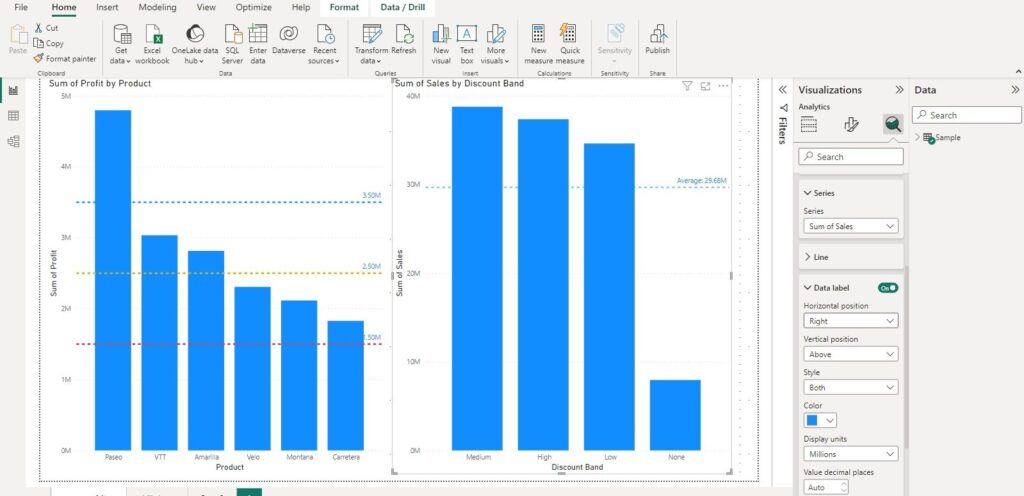
Setting Markers for target:
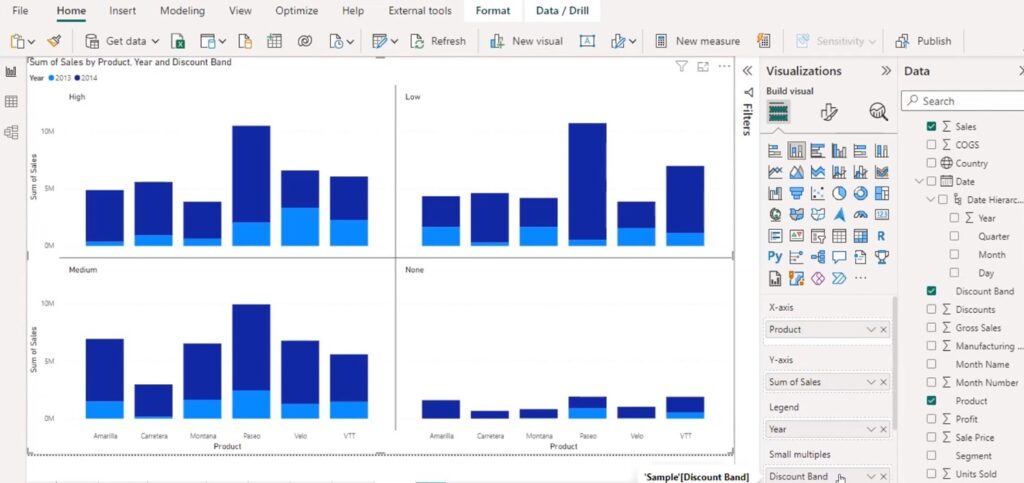
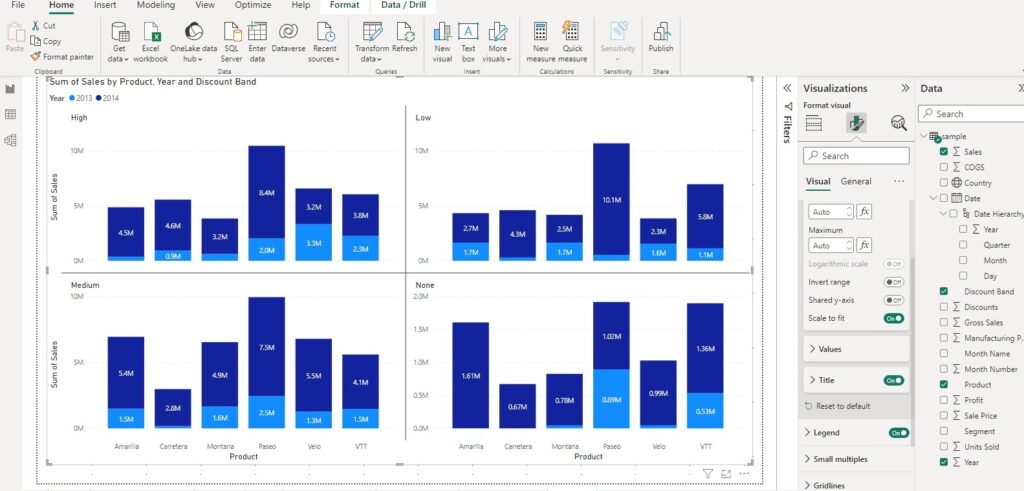
Stack bar vs clustered bar
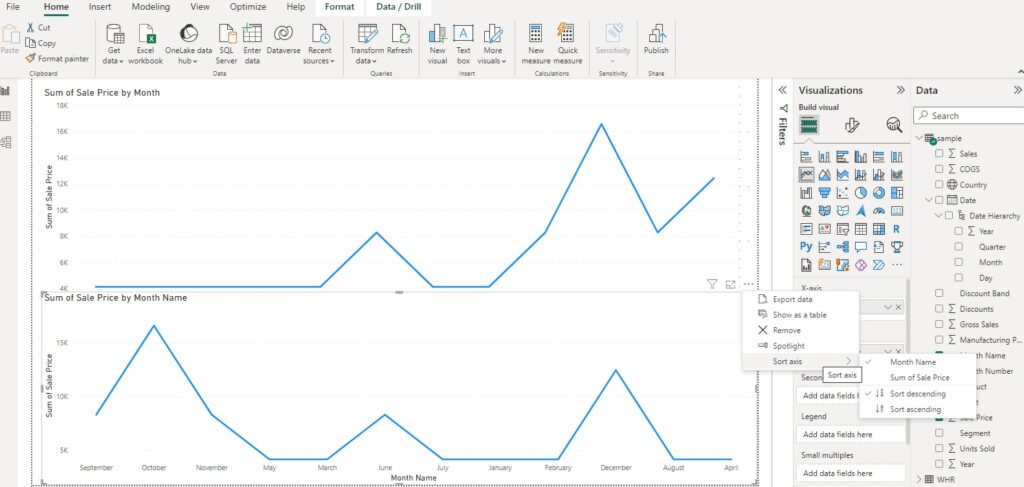
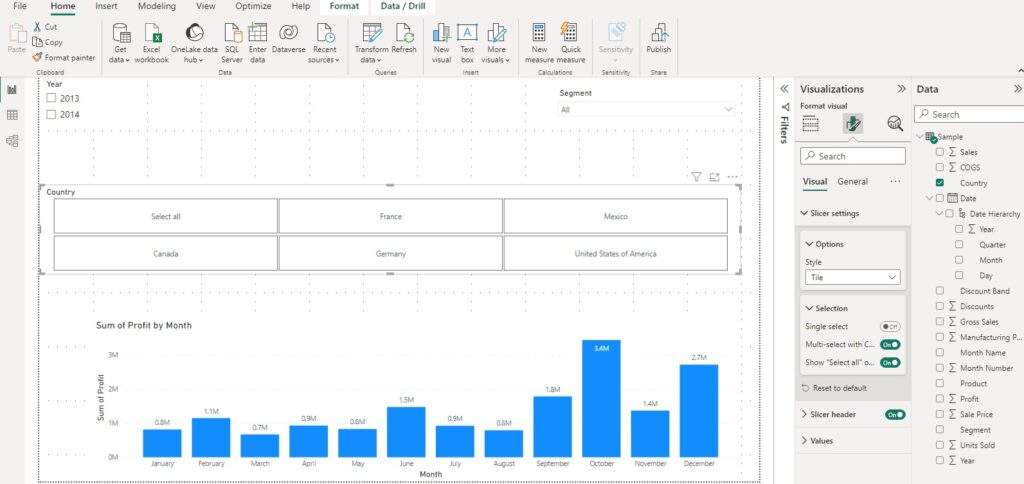
Slicer for controlled output:
Date Table:
DateTable =
          var s_yr = YEAR(MIN(ecommerce_data[order_date]))
          var e_yr = YEAR(MAX(ecommerce_data[order_date]))
        return
          CALENDAR(DATE(s_yr,1,1), DATE(e_yr,12,31))
KPI:
m_YTD Sales = TOTALYTD(sum(ecommerce_data[sales_per_order]),DateTable[Date])
m_PYTD sales = CALCULATE(SUM(ecommerce_data[sales_per_order]), DATESYTD(SAMEPERIODLASTYEAR(DateTable[Date])))
m_YTD Profit = TOTALYTD(SUM(ecommerce_data[profit_per_order]), DateTable[Date])
m_YTD Quantity = TOTALYTD(SUM(ecommerce_data[order_quantity]), DateTable[Date])
m_YTD Profit Margin % = DIVIDE([m_YTD Profit], [m_YTD Sales])
Vizualisation Project:
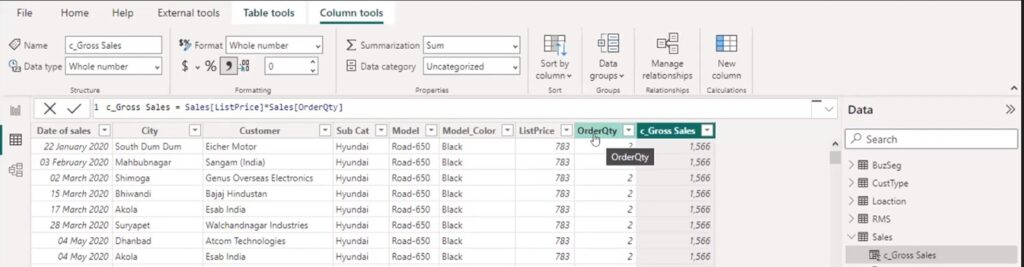
Gross sales:
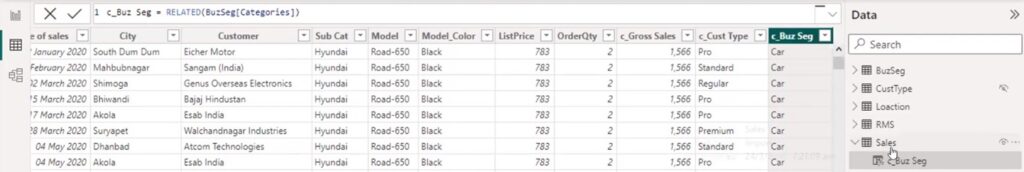
Related business segment to sales table:
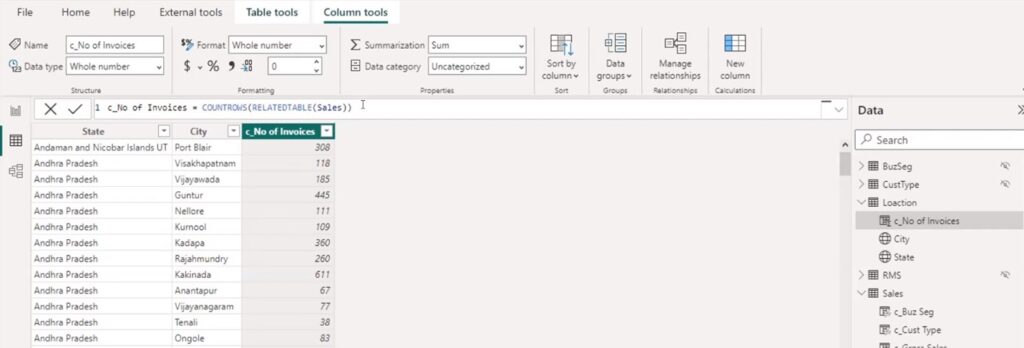
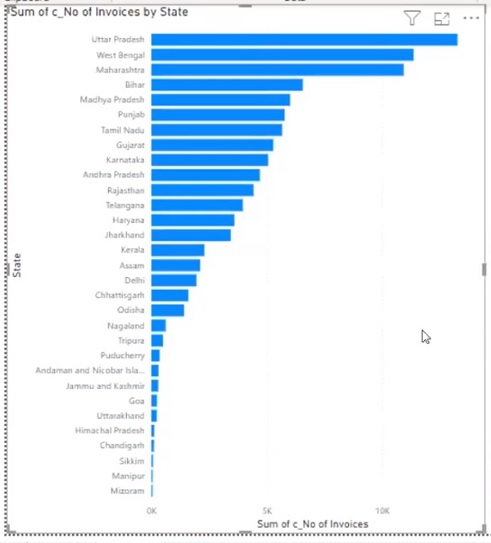
Number of Invoices from related table sales:
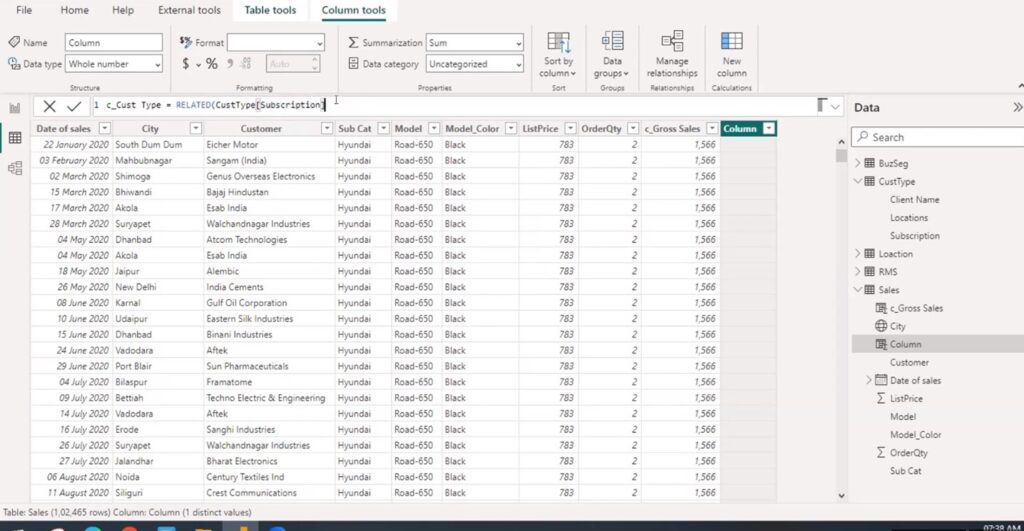
Related customer type from CustType table to sales table:
Dashaboard building:
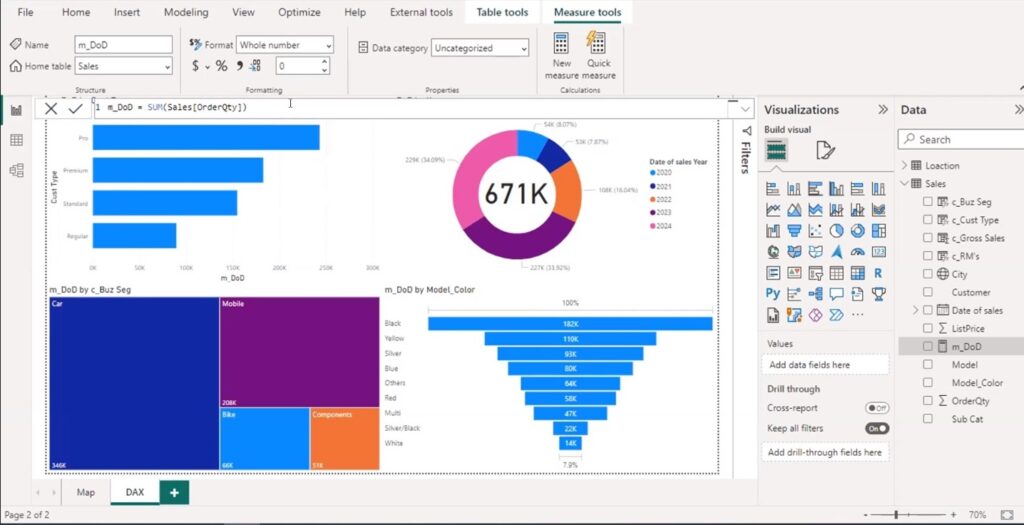
Sum of sales measure:
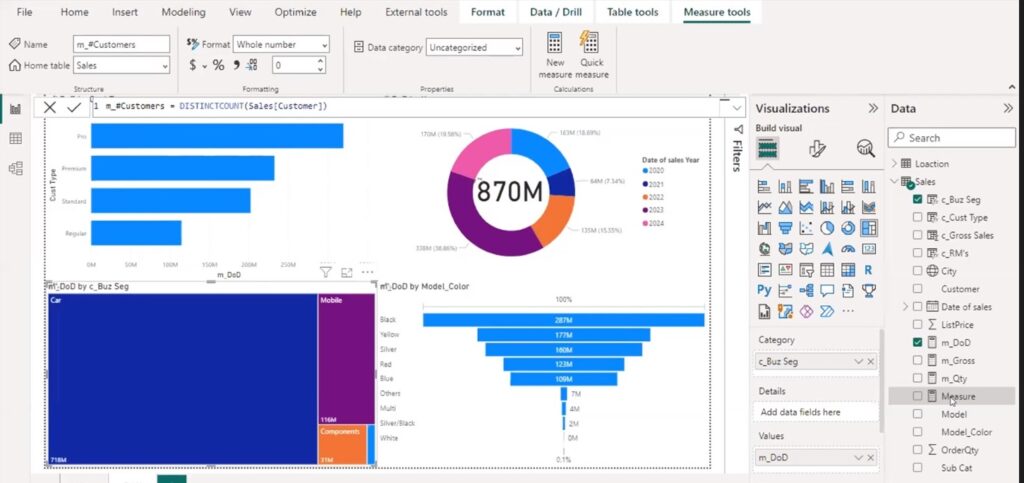
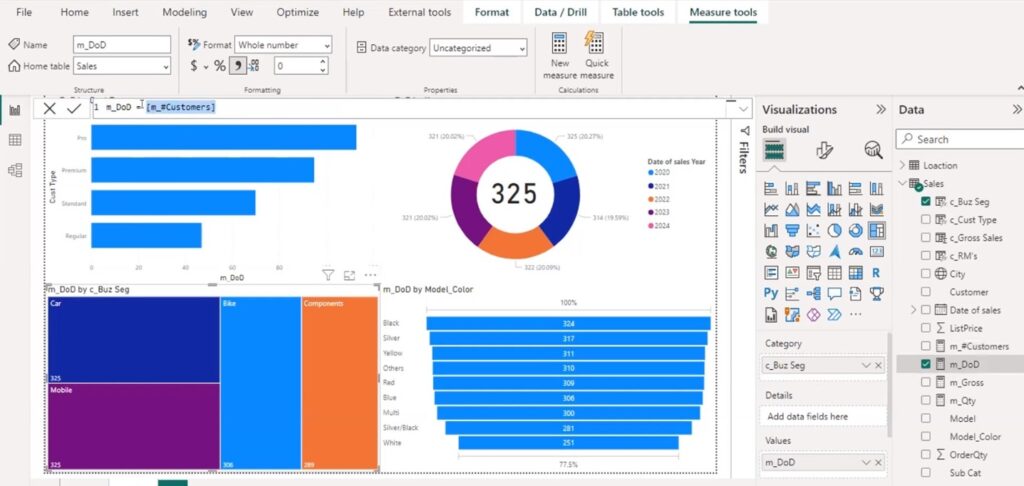
Distinct count of customers:
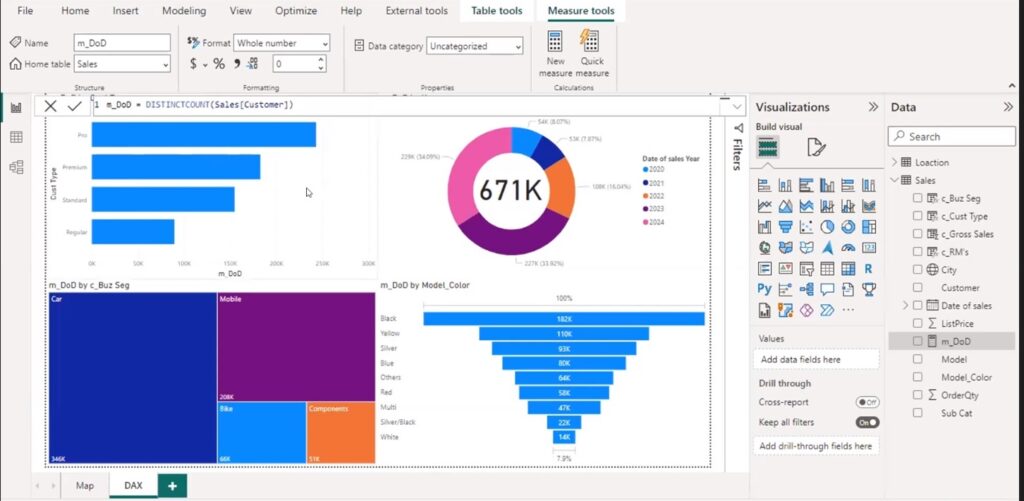
Number of customers:
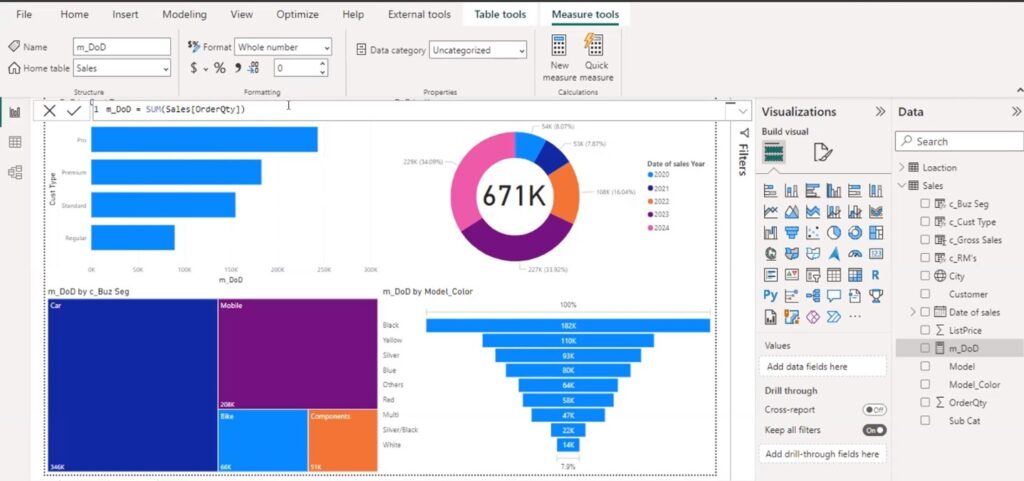
Order quantity measures:
Recent Comments