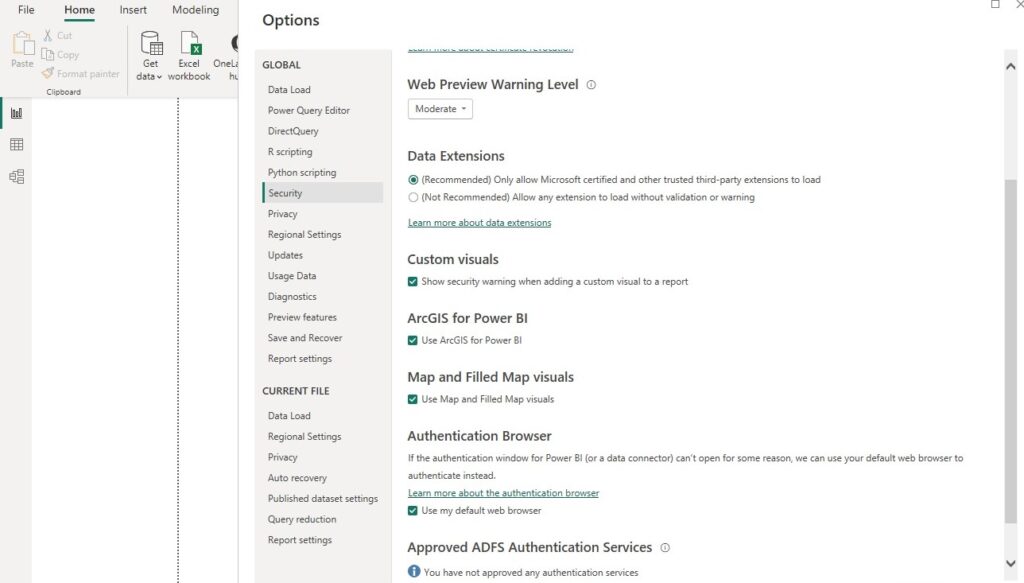
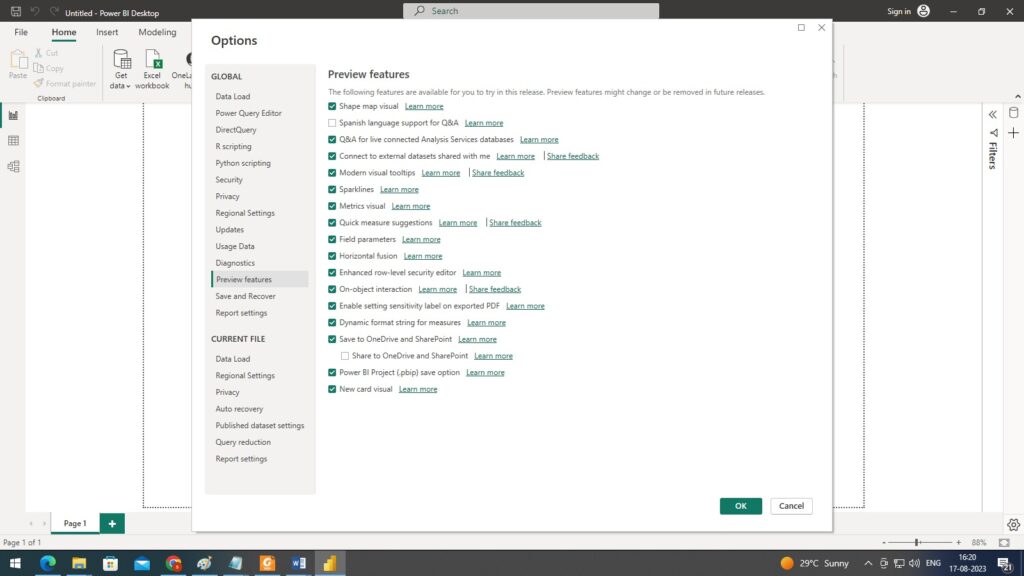
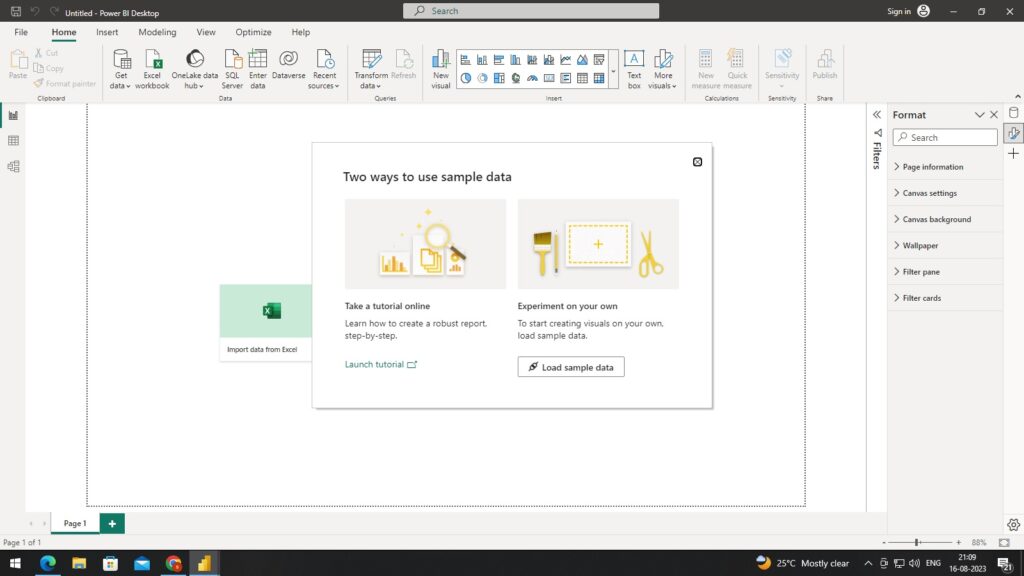
Getting started:
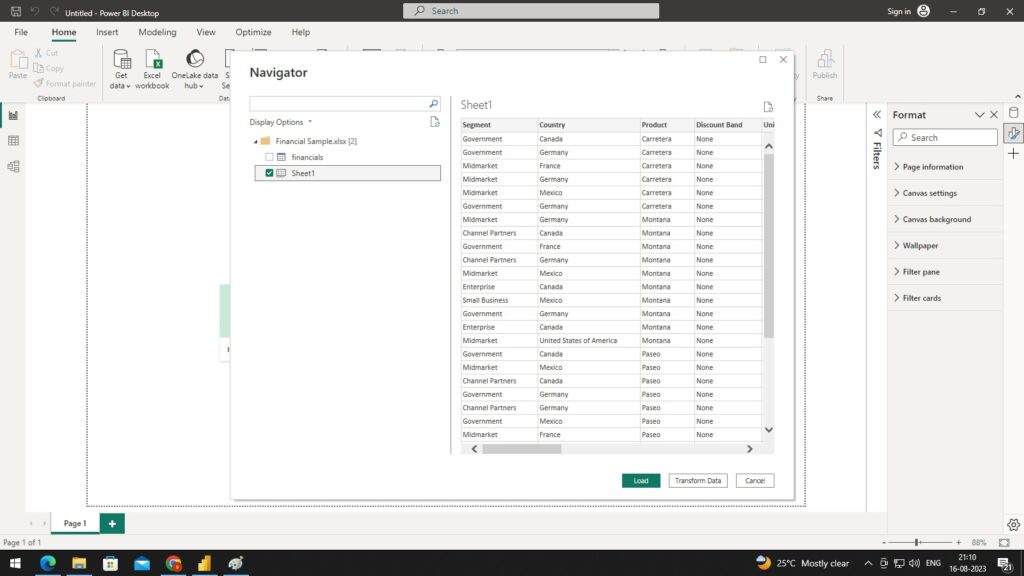
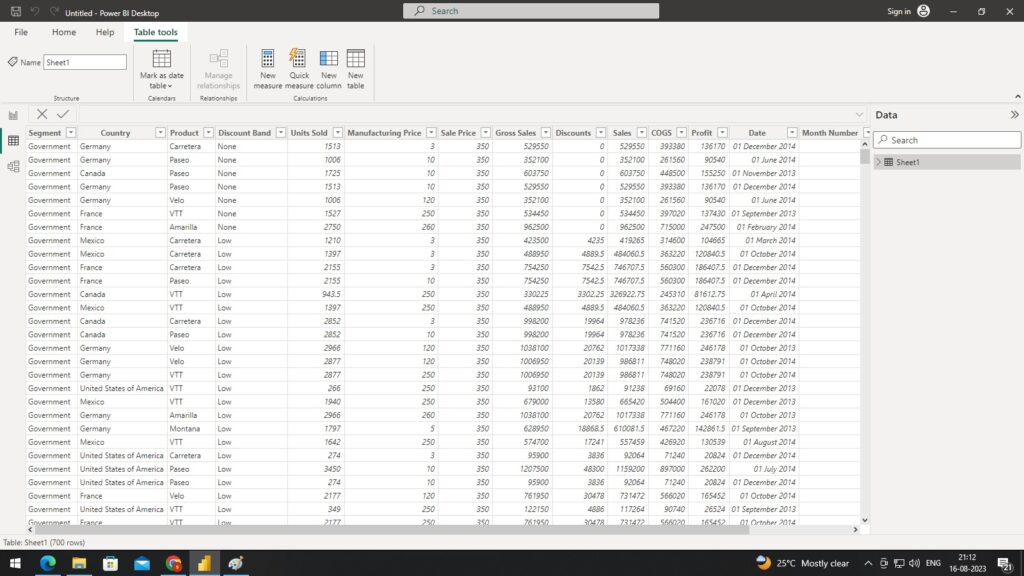
Load sample financial dataset:
Transform data:
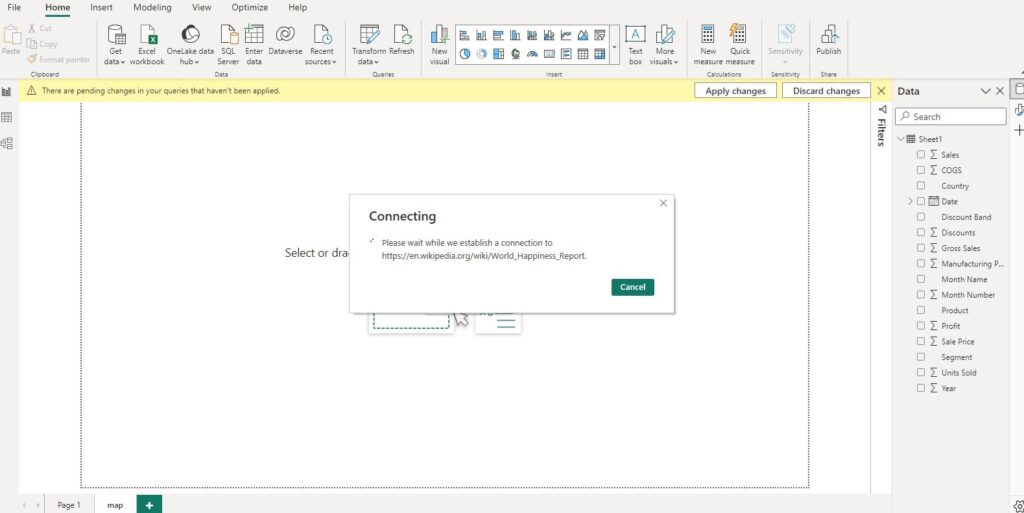
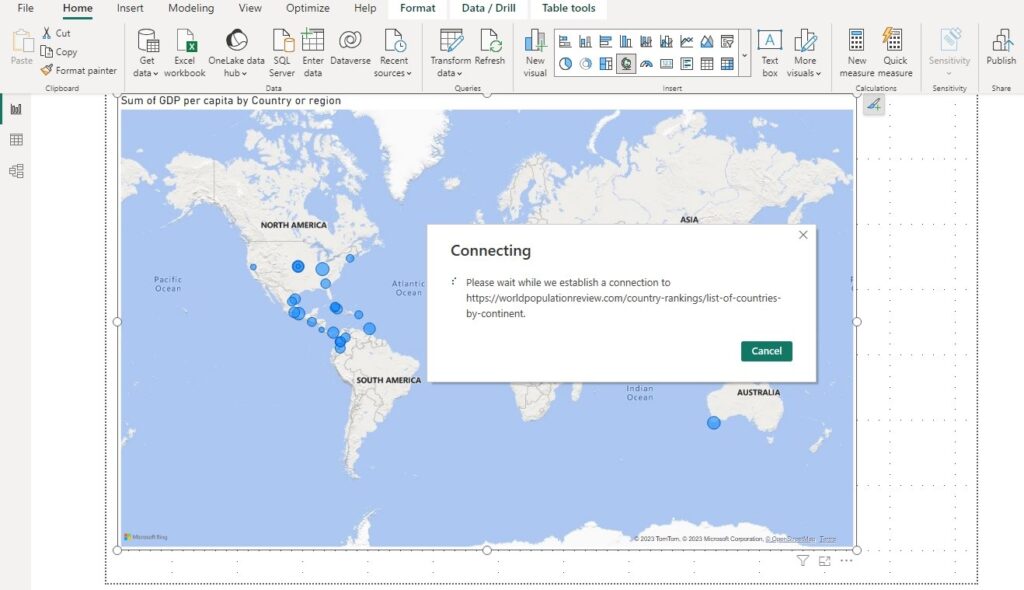
Web scrapping for World Happiness Report:
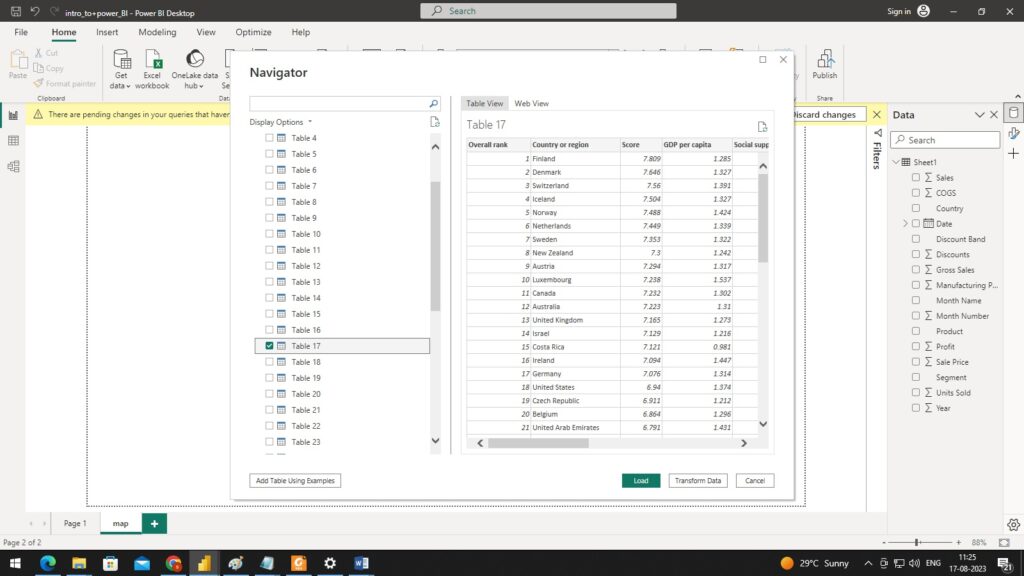
Previewing to Select data:
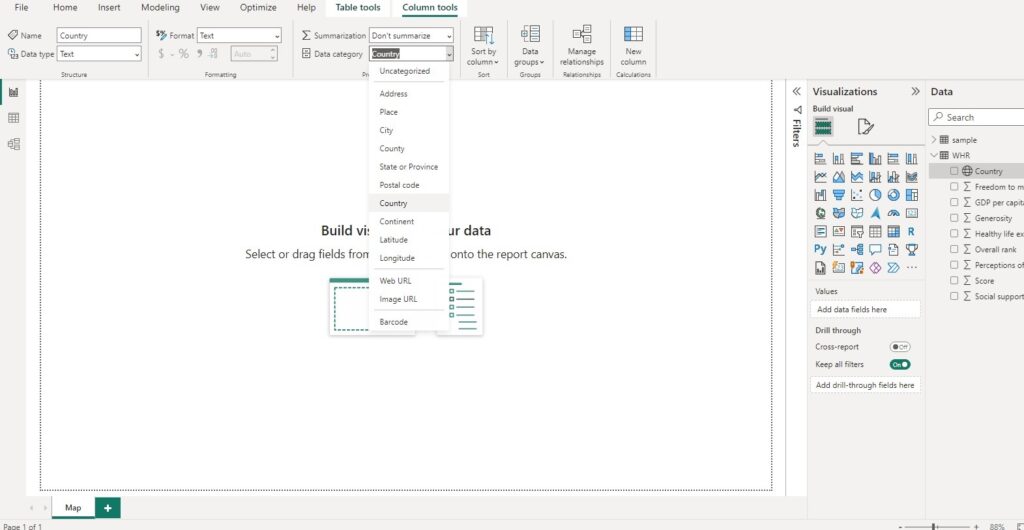
Tagging geo location:
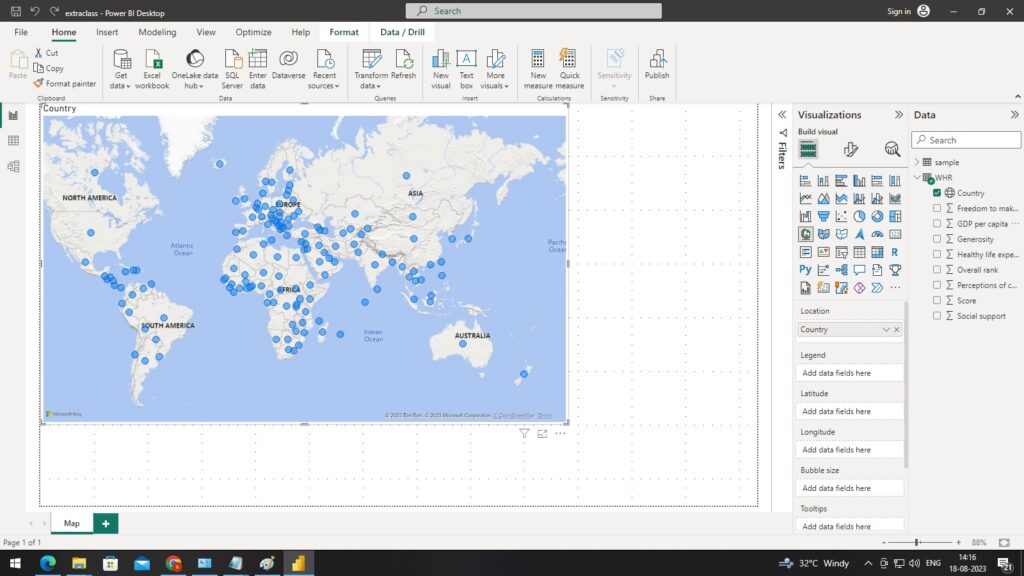
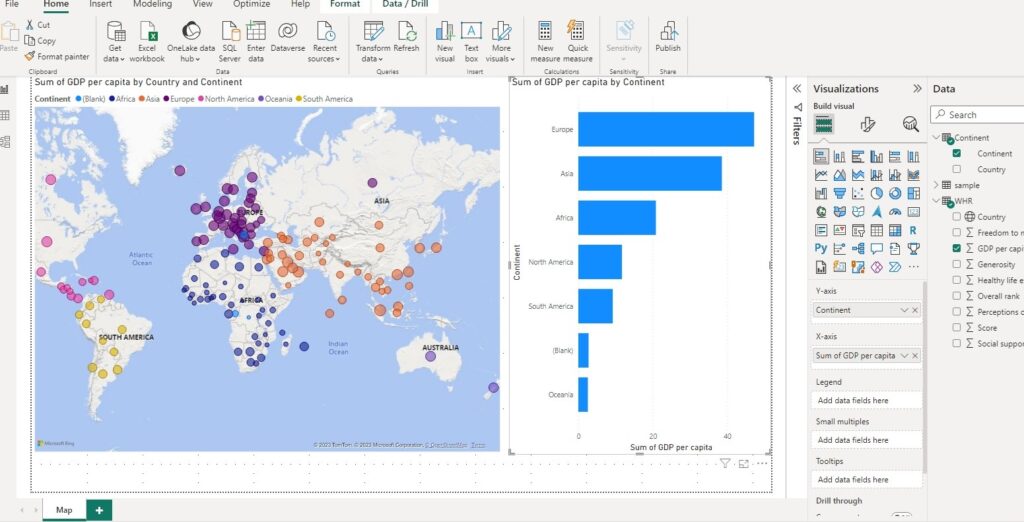
Creating visual Map:
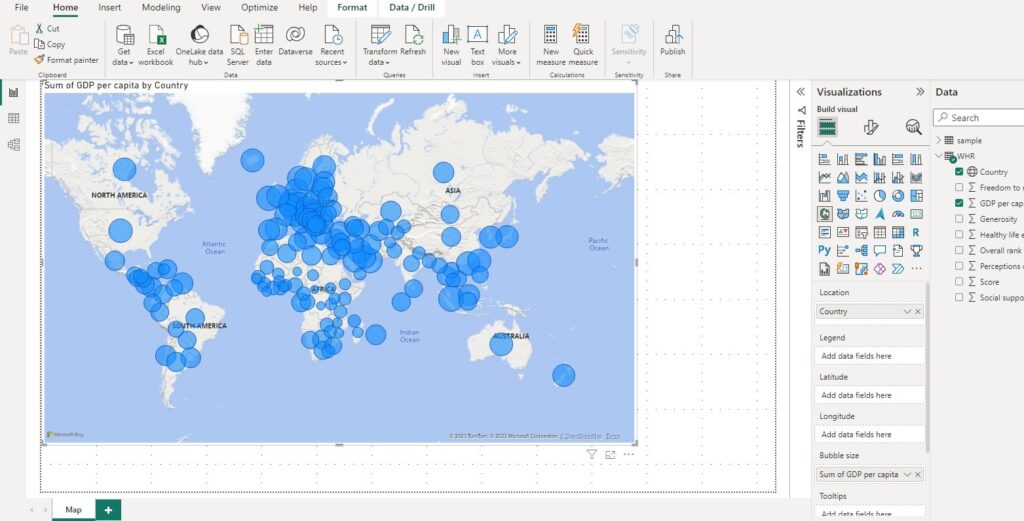
GDP per capita in Bubble size:
Creating hierarchy for countries:
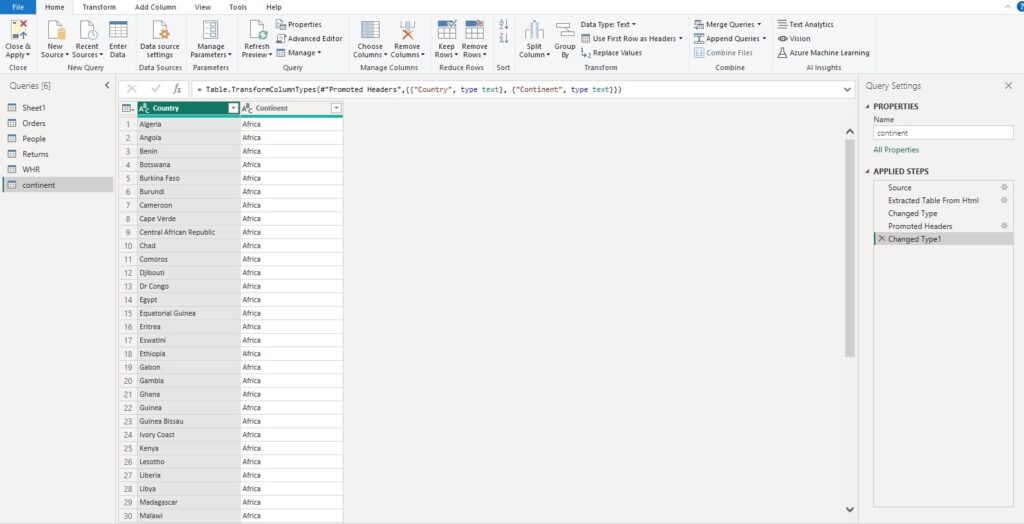
Power query editor:
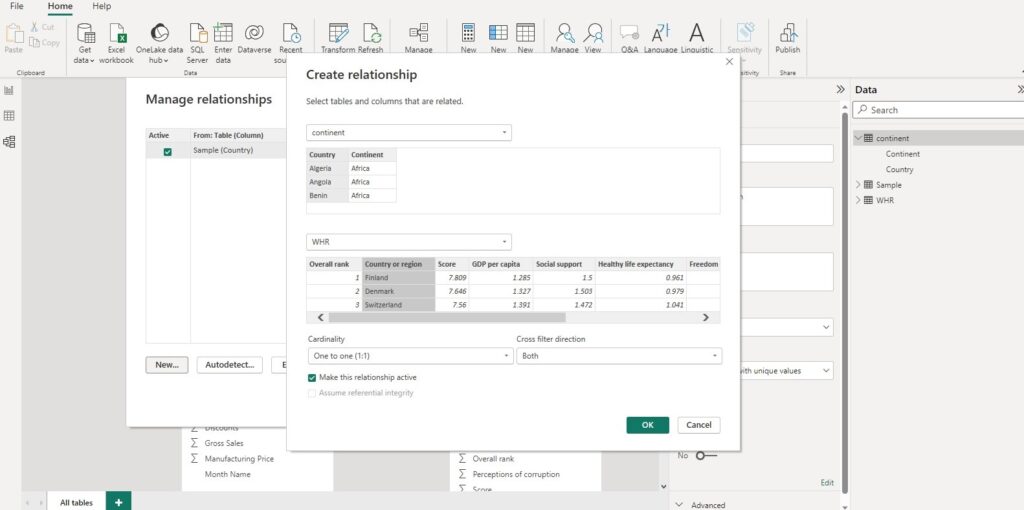
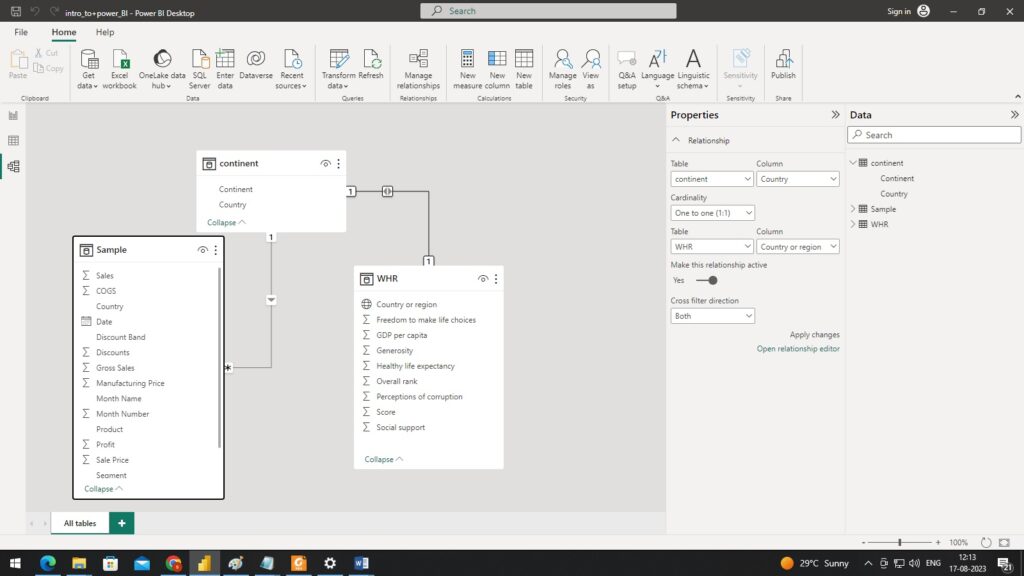
Create relation:
Continent wise GDP:
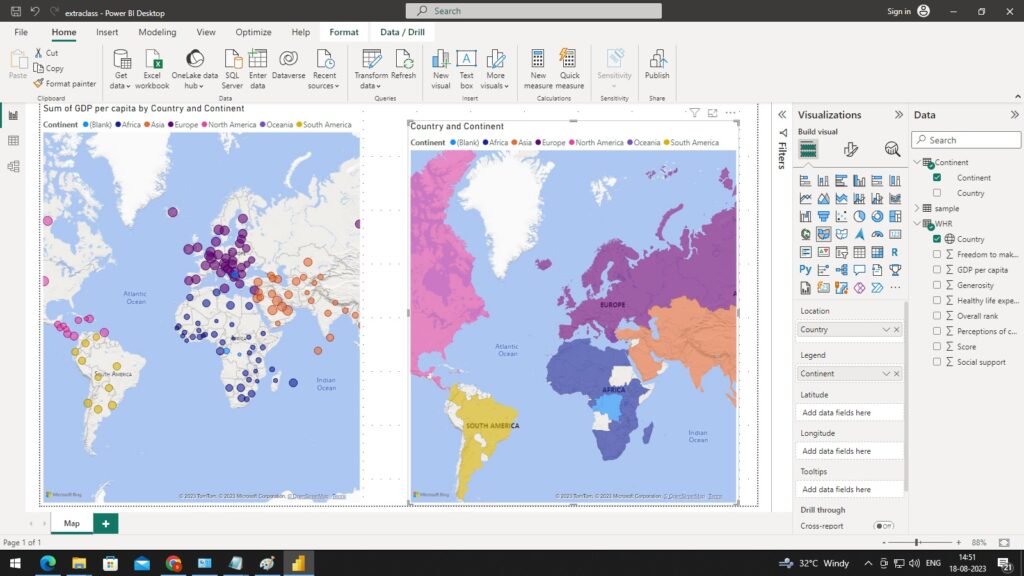
Normal Vs Fill Map:
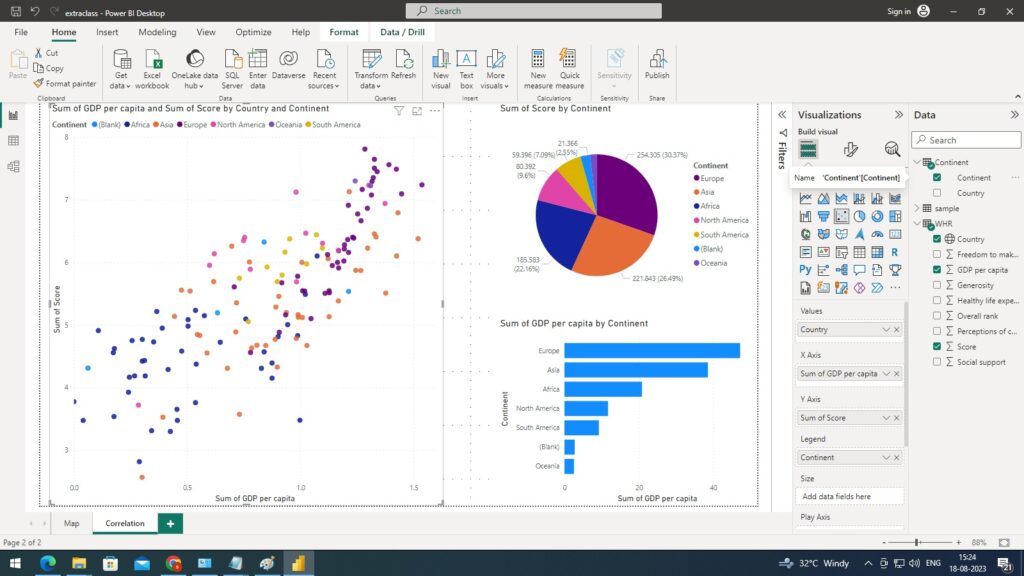
Scatter plot:
Values – Country, X axis – Sum of GDP per capita, Y axis – Sum of Score
Legend – In continent(Optional)
Recent Comments