Practice:
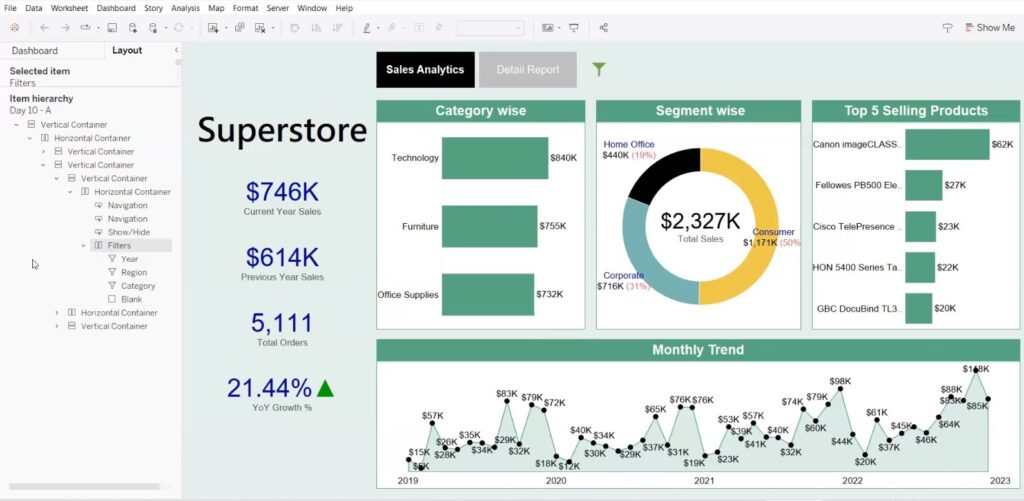
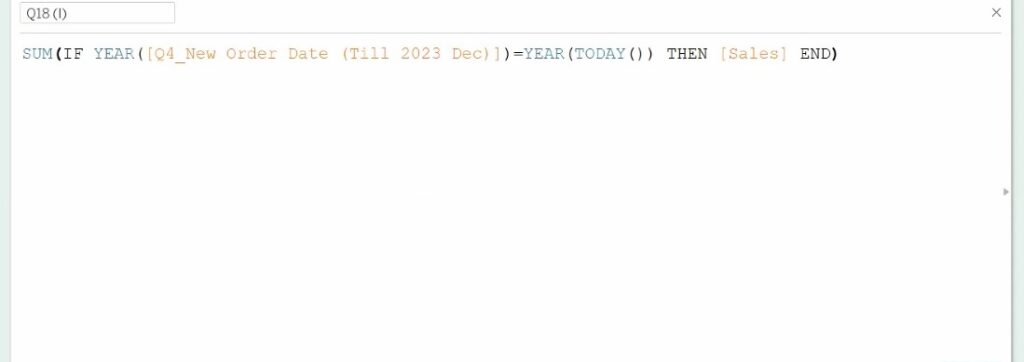
Current Year sales:
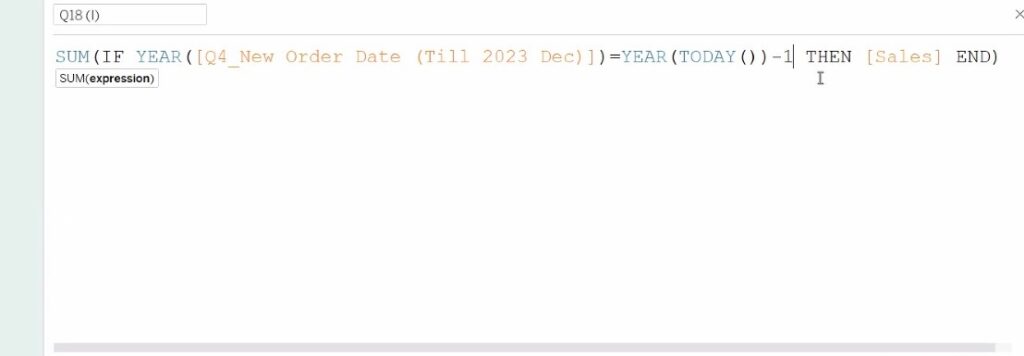
Previous Year Sales:
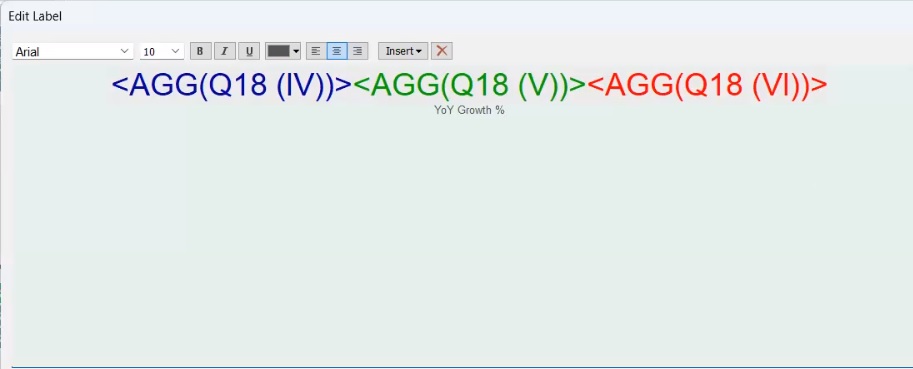
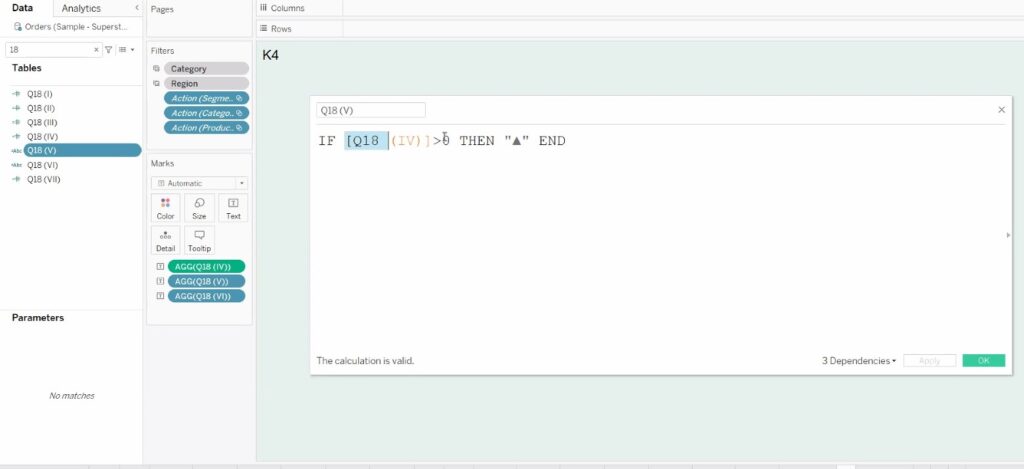
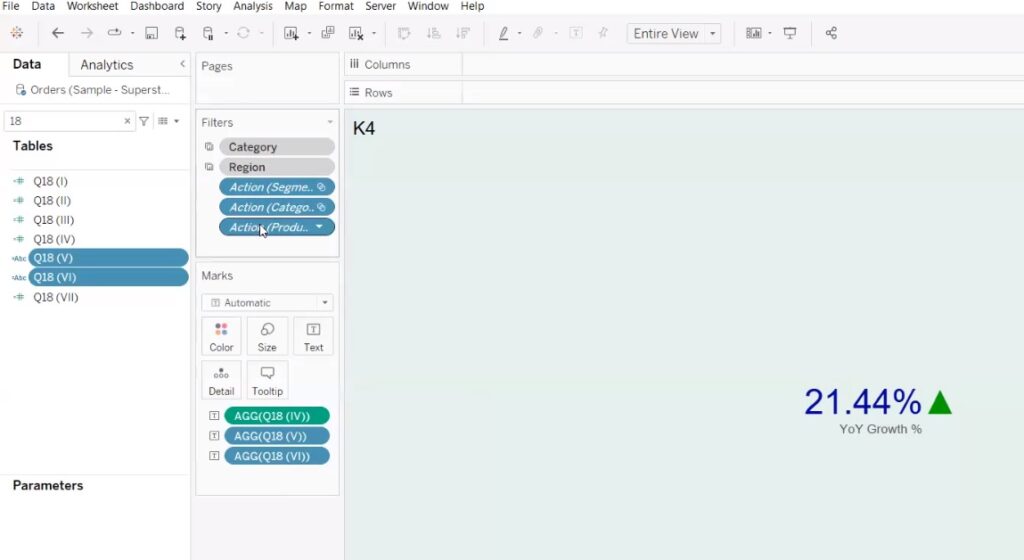
Formatting profitablity:
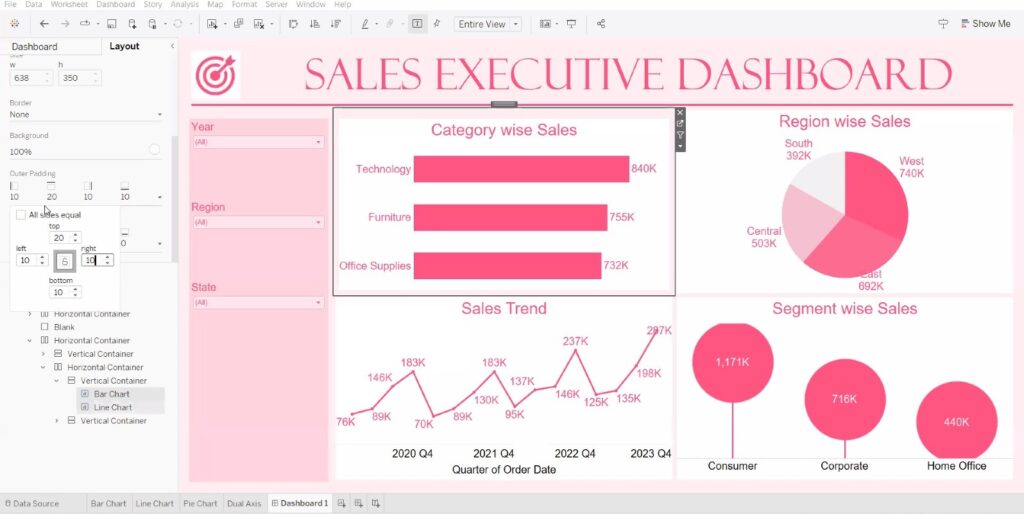
Steps building Dashboard:
1.First adjust dashboard size as per your requirement
2.Ensure Floating selected and drag vertical container, Go to Layout and adjust its x,y and Height and Width
3.Click on Tiled, Add two blank container for placement purpose(Helping hand to place other container)
3.1 Give a red color boarders to these blank container so that we can easily identify and
later they can be removed
4.You can either vertical or Horizontal containers as per your objects placement
5.Take horizontal container as it allows us to place all our KPIs or Objects side by where as vertical container will be useful to place object one underneath another
6.To give a line kind of object take a text object fill the back ground color to light gray and adjust its width 10 ,select text object and go to layout and changed the background color to light
gray after that dropdown on text object and change to width to 10
7.If you hold shift and drag any object which works like a floating
RESET FILTER
Create a new sheet
crate a calculated filed and name it reset filter
and change the mark type to shape and add your own reset image
To set all the filters to “ALL”, you must create action filter.
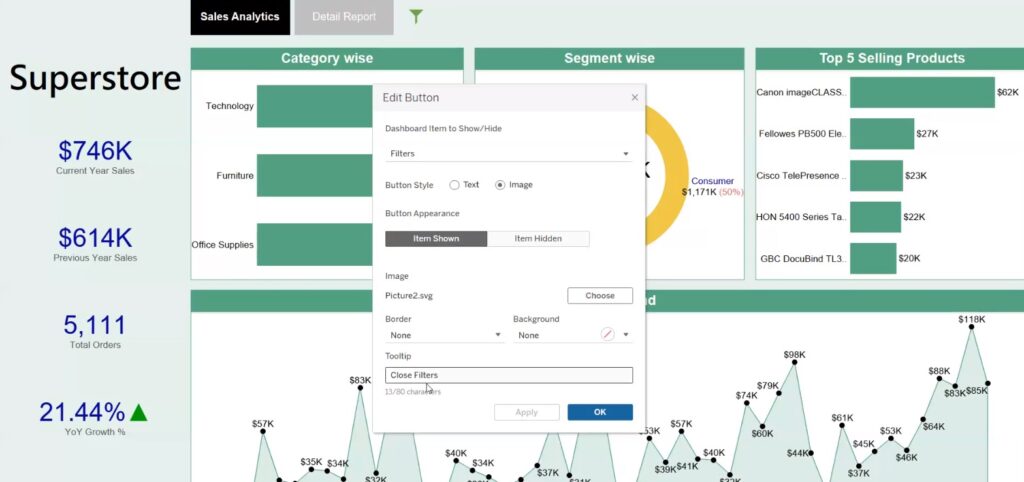
Show /Hide Filter with navigation tab:
Recent Comments