Sample statistics:
We describe the sample which is subset of the entire population using sample statistics. The sample statistics usually characterize the sample and not the population. Sample statistics can broadly classified into two type –
- Sample Mean – used when the variable is continuous like
• Height of a group of people
• User engagement on a website - Sample percentage – normally used when the variable is Binary (yes/no) like
• Do you support this candidate?
• Is this drug an effective treatment?
Standard deviation (SD) of the sample is critical as it will allow us to determine the confidence interval around the assertion which we will manner. The manner in which we calculate the standard deviation of the sample is different for sample mean and sample percentage.
standard deviation:
standard deviation of the sample when we are interested in sample mean

Below shows standard deviation of the same when we are interested in sample percentage

where p is the % of YESes
Central Limit theorem:
The normal distribution is entirely defined by 2 parameters µ & σ with the following formula. In other word, given the mean and SD, we can tell the probability of any value.
Sample Statistics and Sampling Distribution:
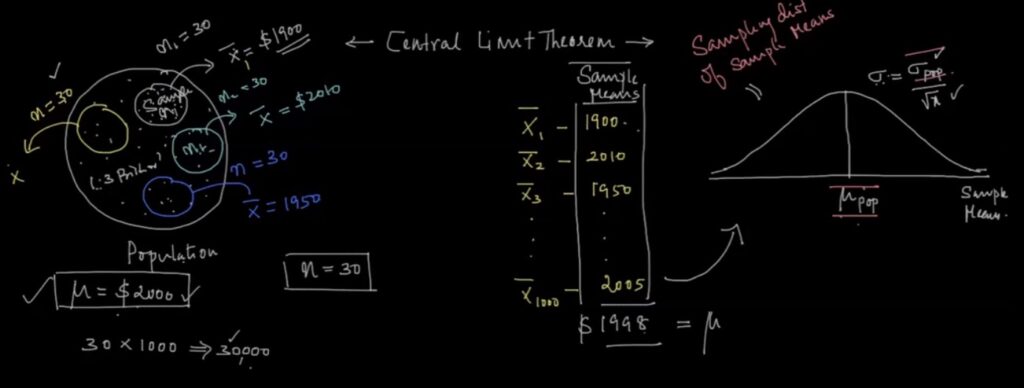
Let us pick 100 different samples of any dataset from any population. For each of these samples, you then compute the sample mean or % as shown below. These computed sample mean or % will vary as it is different for each sample and hence, we call it as random variable.

If we plot the histogram of these values, that will represent its probability distribution. It turns out whenever you take a large number of samples, the sample % or sample mean of those samples follows a normal distribution.

The best estimate of a sample distribution’s mean is its sample average ie, μ = x̄
For sample mean, σ = SD / SQRT (N), where N is the number of points in our datasets
For Sample percentage, σ = SD
So as of now, we have
1. Sample mean
2. Standard deviation of the sample
3. Sample standard error
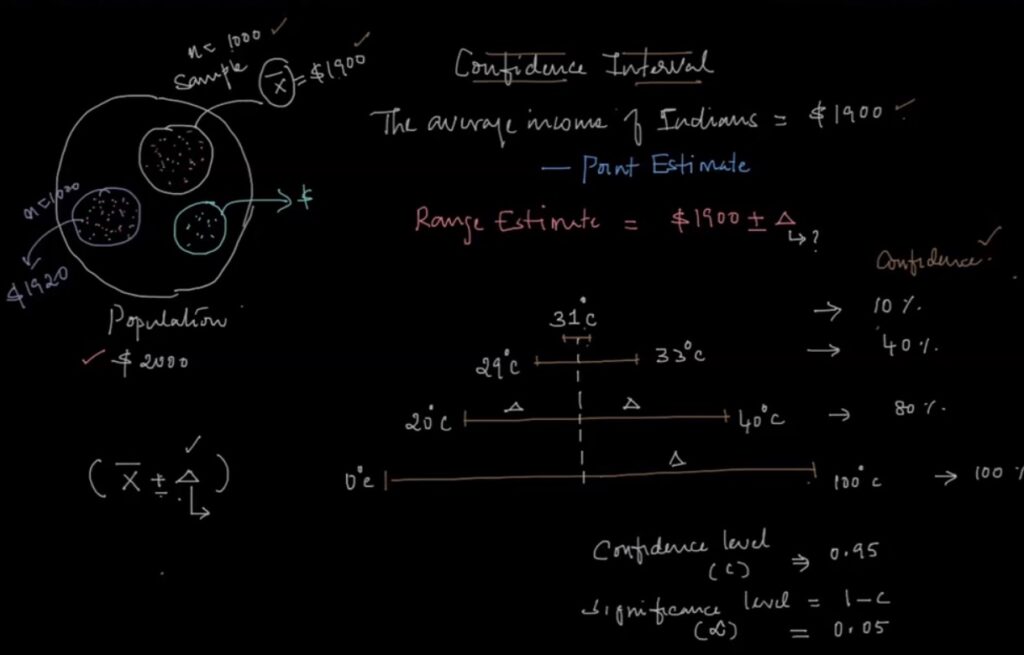
Using these 3 numbers, we can now make assertion or inference about the population. Most of the inference fall under few specific types and there are standard procedures involved for each type to draw inference. Below are the inference types and an example for each types
| population mean | |||
| Indian Police are on average 80KG +/- 5 KG with 95% confidence | |||
| Is the average life expectancy of Indians is 70 years? | |||
| Indians are on average taller than Chinese | |||
| population percentage: | |||
| 20% +/- 2% of software engineers in a given city goes for morning walk | |||
| 20% of people who took the drug has a side effect | |||
| Only 10% of people who don’t take the drug get better, but 80% of people who take the drug better. |
Calculating significance:

Point estimate vs Range estimate:
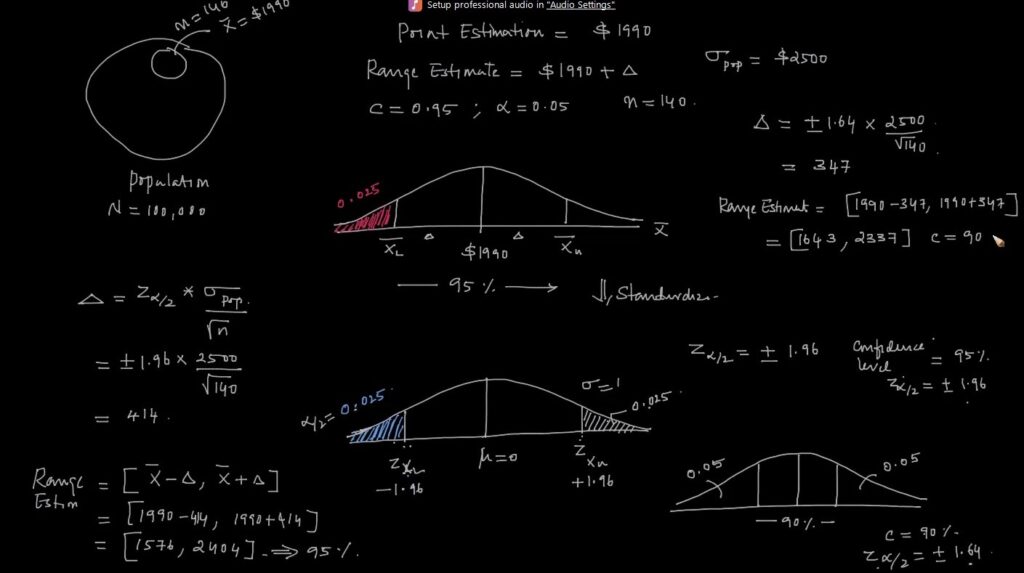

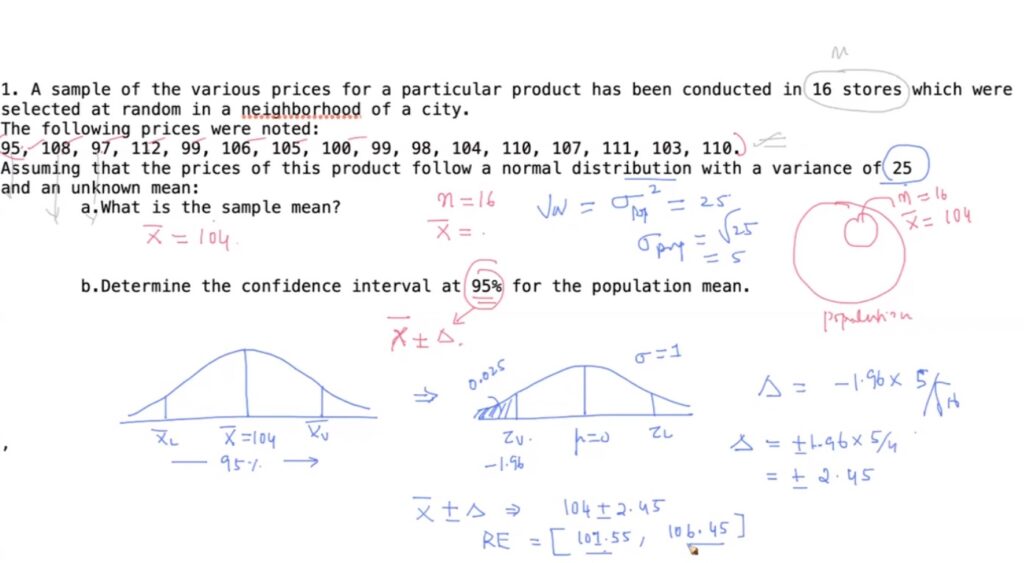

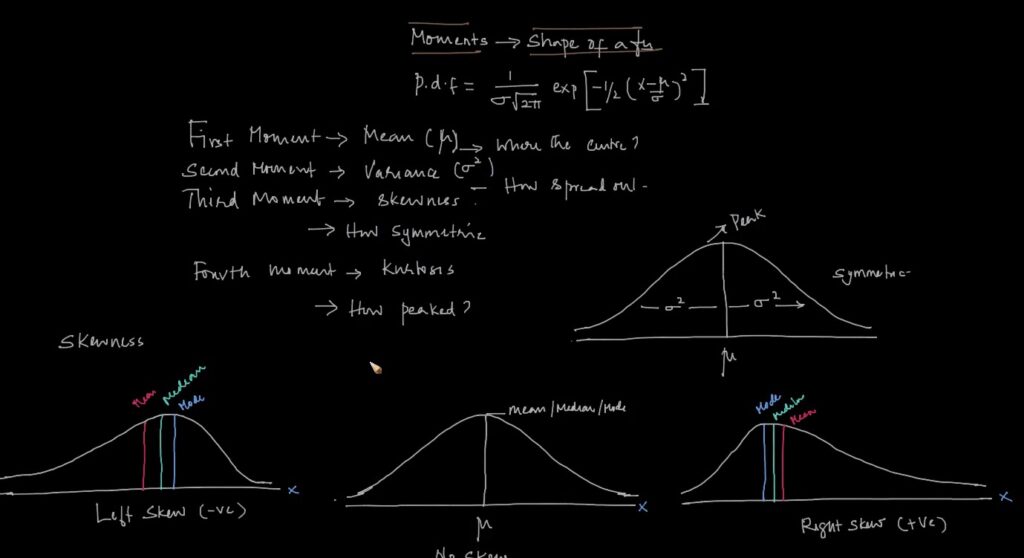
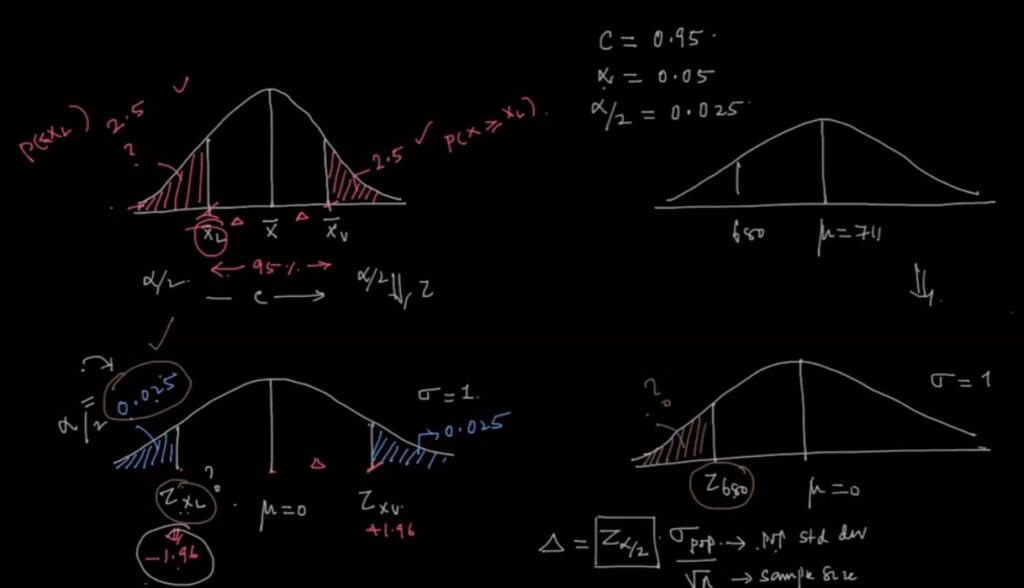
The normal distribution is entirely defined by 2 parameters µ & σ with the following formula. In other word, given the mean and SD, we can tell the probability of any value. Or simply we can define as f(x) = F(x, μ, σ)

Recent Comments