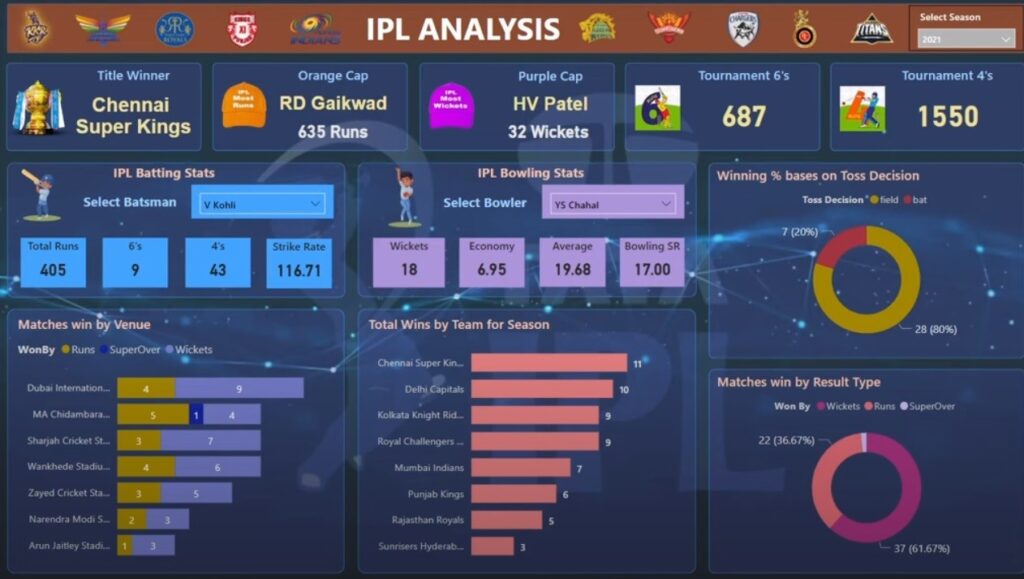
KPI’s as DAX measures for winning measures:
Matches win on toss decision = CALCULATE(COUNTROWS(ipl_matches_2008_2022),ipl_matches_2008_2022[toss_winner] = ipl_matches_2008_2022[winner])CALCULATE used to calculate the number of matches.
COUNTROWS counts the number of rows essentially counting the total number of matches in the dataset.
a condition or filter is applied to checks if the “toss_winner” is equal to the “winner” for each match. In other words, it identifies matches where the team that won the toss is the same as the team that won the match.
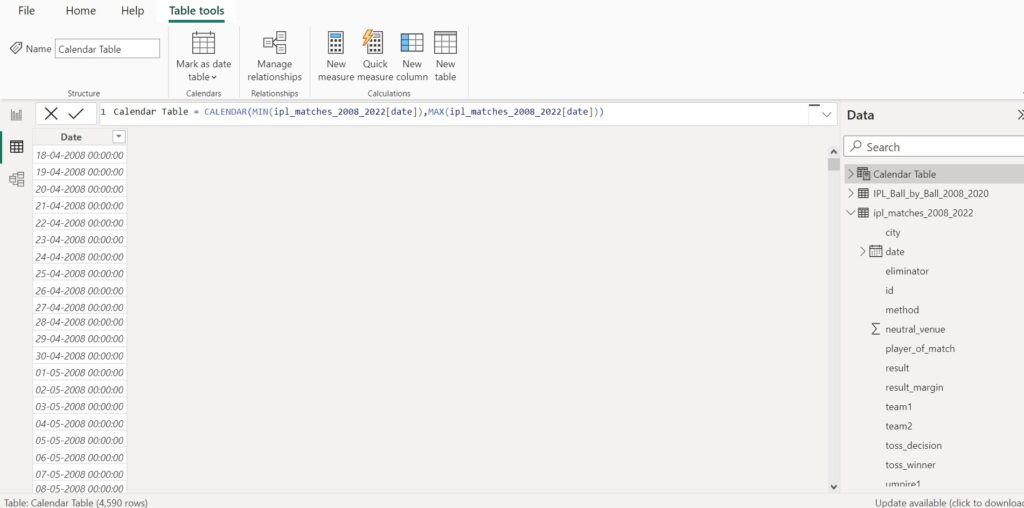
Title Winner =
   var max_date = CALCULATE(MAX('Calendar Table'[Date]), ALLSELECTED(ipl_matches_2008_2022),       VALUES(ipl_matches_2008_2022))
var title_winner = CALCULATE(SELECTEDVALUE(ipl_matches_2008_2022[winner]),'Calendar Table'[Date] = max_date)
return title_winner
It calculates the maximum date from the ‘Calendar Table'[Date] column. It uses the CALCULATE function, which allows for the evaluation of an expression in a modified filter context.
The MAX function returns the maximum date value.
ALLSELECTED preserves the selection from filters applied to table, which is useful in maintaining context when calculating the maximum date.
VALUES retrieves all the unique values from the table, effectively removing any filter context for that table.
Bowling unit logics:
Function for Bowler Wickets calculates the total number of wickets taken by bowlers for the dataset within the specified range
The result is combined with the text ” Wickets” using the CONCATENATE function to create a descriptive label
Bowler Wickets = CONCATENATE(SUM(IPL_Ball_by_Ball_2008_2020[is_wicket])," Wickets")
Bowling Strike rate = COUNT(IPL_Ball_by_Ball_2008_2020[bowler])/SUM(IPL_Ball_by_Ball_2008_2020[is_wicket])
Bowling strike rate is a measure of a bowler’s effectiveness in taking wickets.
It is calculated as the total number of wickets divided by the total number of deliveries or balls bowled.
A lower bowling strike rate indicates that a bowler takes wickets more frequently, which is considered a good performance in cricket.
Avg by bowler:
Avg by bowler = DIVIDE(
            SUMX(
                FILTER(IPL_Ball_by_Ball_2008_2020,IPL_Ball_by_Ball_2008_2020[extras_type]<>"legbyes" && IPL_Ball_by_Ball_2008_2020[extras_type]<>"byes"), IPL_Ball_by_Ball_2008_2020[total_runs]), (sum(IPL_Ball_by_Ball_2008_2020[is_wicket])
))
Filter part filters the dataset to exclude rows where the ‘extras_type’ column is either “legbyes” or “byes.” It ensures that only legitimate deliveries (excluding these extras) are considered.
Within the filtered dataset, sumx function calculates the sum of the ‘total_runs’ for each delivery, essentially totaling the runs scored off each legitimate delivery.
The sum part calculates the total number of wickets taken by bowlers, which is summed up across all deliveries.
Finally, the divide function divides the total runs conceded by the total wickets taken. This calculation results in the average runs conceded per wicket taken by the bowlers.
Economy:
Economy = DIVIDE(
            SUMX(
                FILTER(IPL_Ball_by_Ball_2008_2020,IPL_Ball_by_Ball_2008_2020[extras_type]<>"legbyes" && IPL_Ball_by_Ball_2008_2020[extras_type]<>"byes"), IPL_Ball_by_Ball_2008_2020[total_runs]), (count(IPL_Ball_by_Ball_2008_2020[over]))/6
)
Filter part filters the dataset to exclude rows where the ‘extras_type’ column is either “legbyes” or “byes.” It ensures that only legitimate deliveries (excluding these extras) are considered.
Within the filtered dataset, sumx function calculates the sum of the ‘total_runs’ for each delivery, essentially totaling the runs scored off each legitimate delivery.
Counts the number of overs bowled by the bowler, which is calculated as the number of entries in the ‘over’ column and is divided by 6, which represents the standard number of deliveries in an over in a cricket match.
Divide function divides the total runs conceded (from step 2) by the total number of deliveries bowled (from step 4).
Batting Unit logics:
Batter runs = CONCATENATE
(SUM(IPL_Ball_by_Ball_2008_2020[batsman_runs])," Runs")
Batting Strike Rate = (SUM(IPL_Ball_by_Ball_2008_2020[batsman_runs])/count(IPL_Ball_by_Ball_2008_2020[ball]))*100
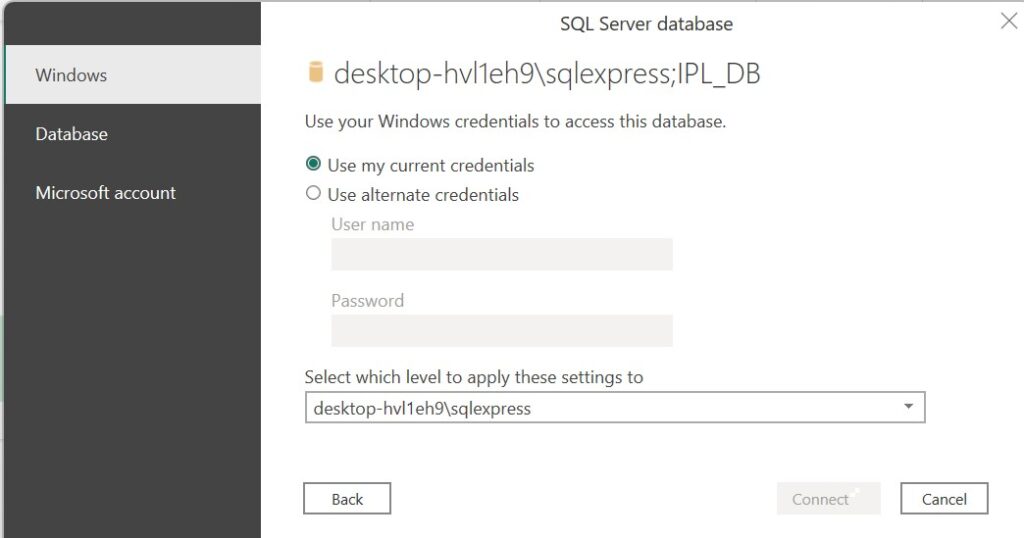
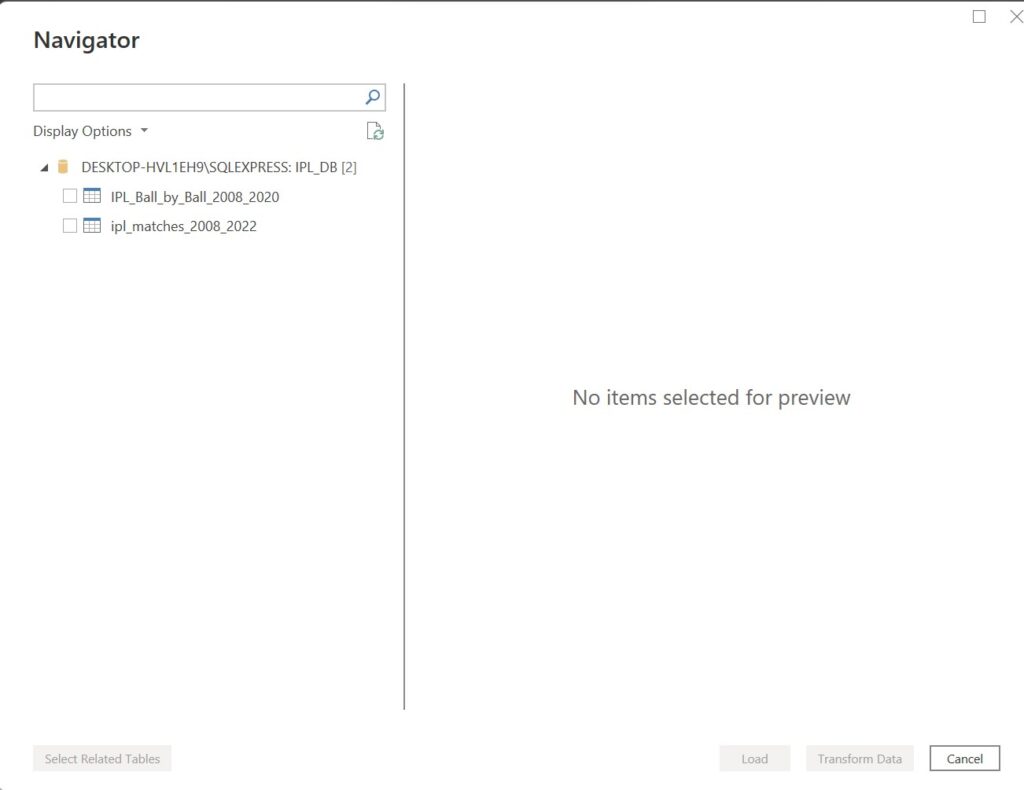
Importing data from SSMS(SQL Server Management Studio):
A DirectQuery query can be run when accessing data from tables in the server.
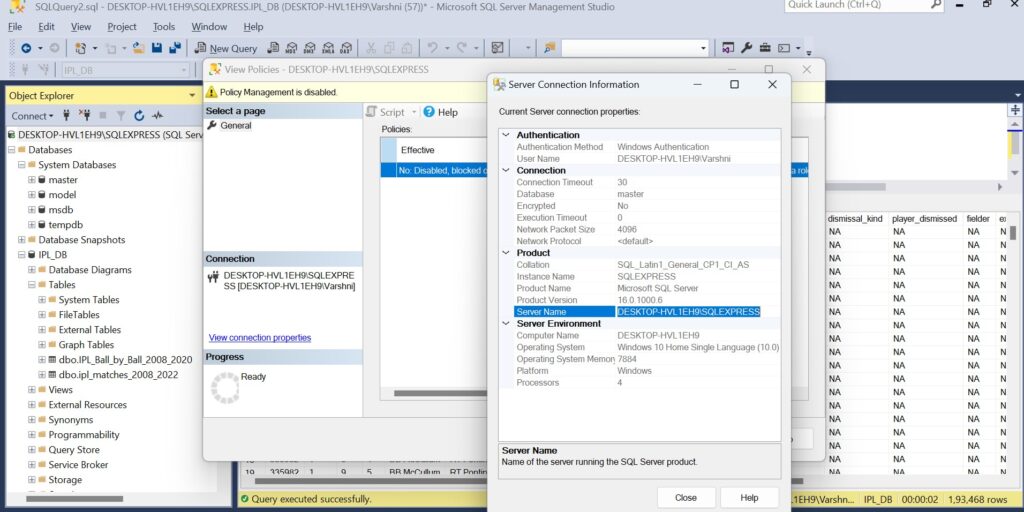
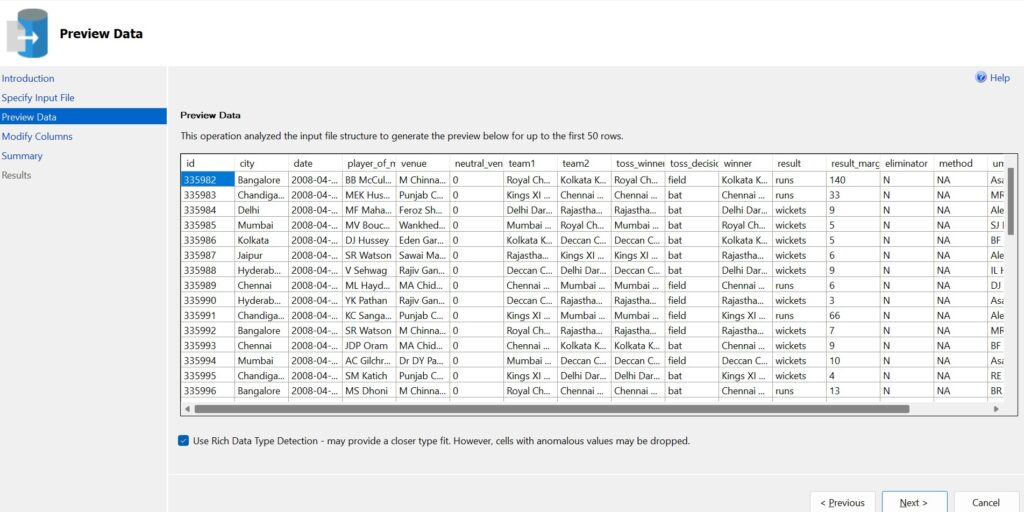
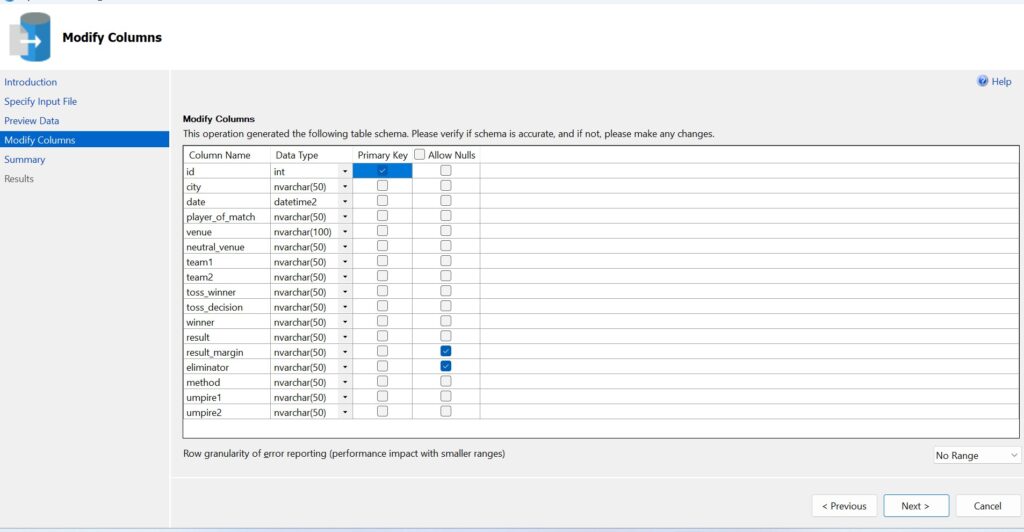
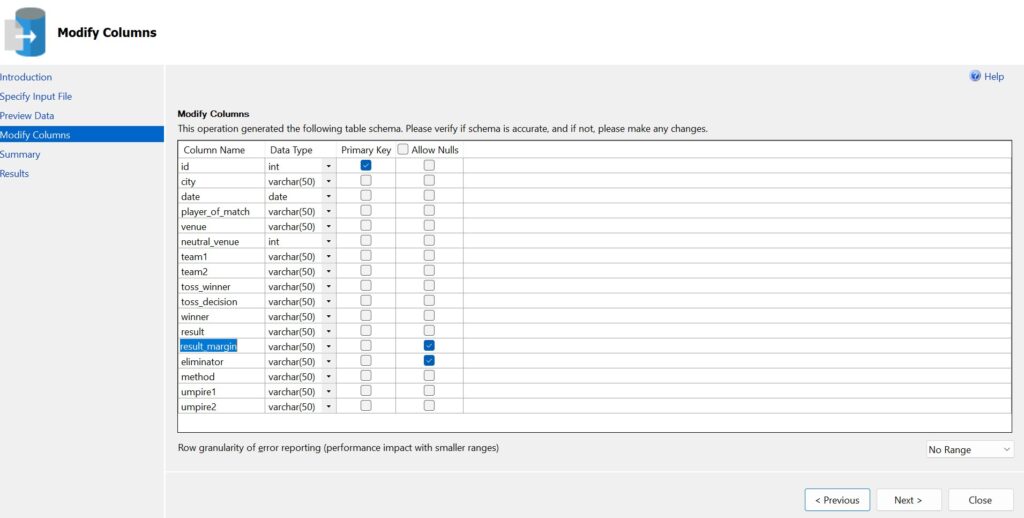
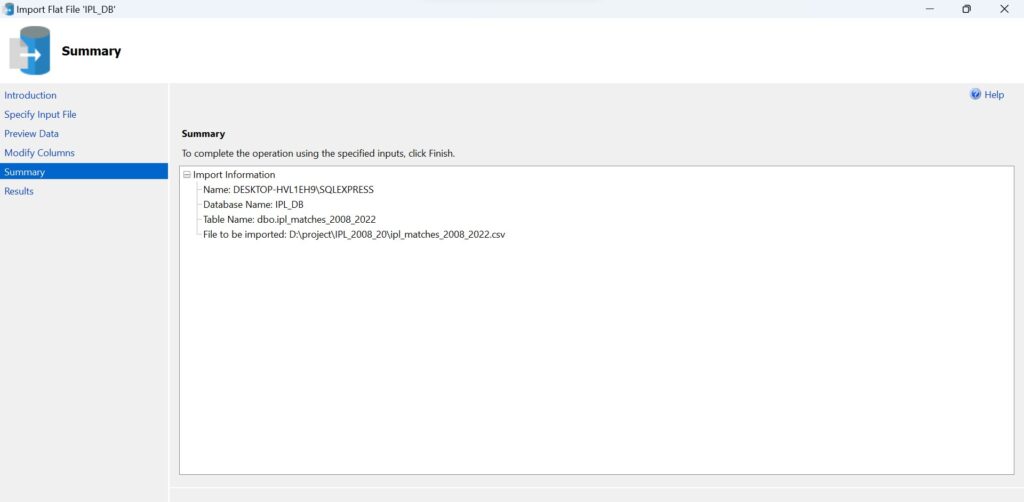
Using DirectQuery mode means the queries are only optimized for specific database. Setting the Storage Mode property of tables to Direct Query reduces the model size since only schema of the data source is stored locally.
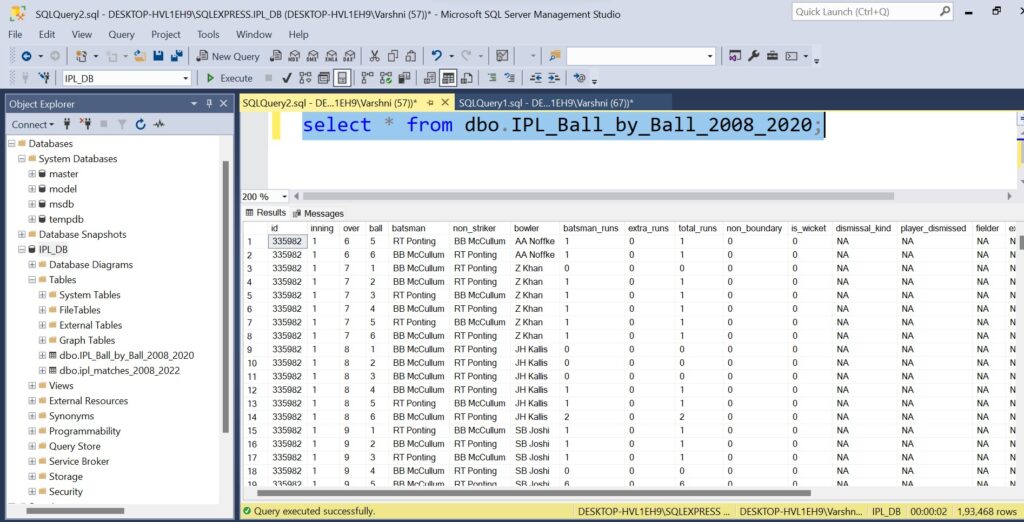
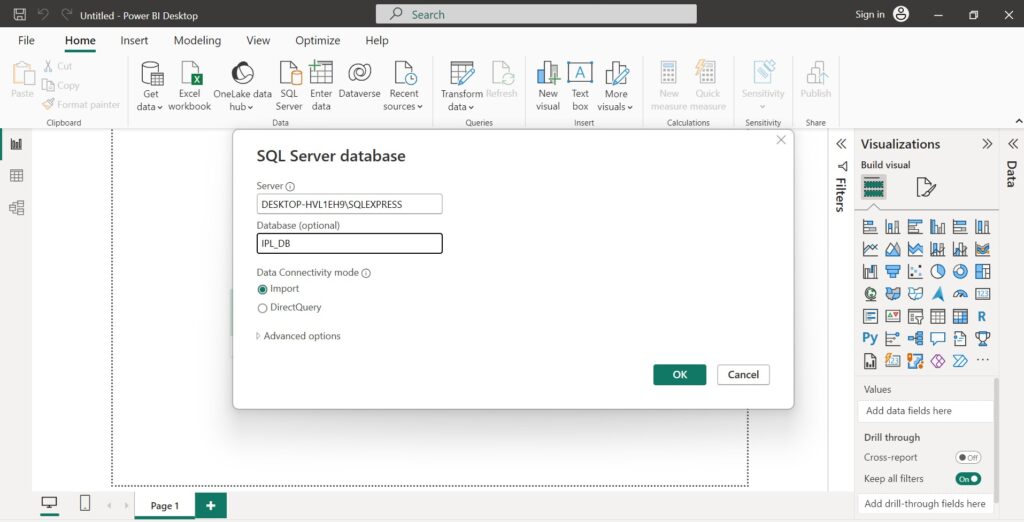
From SSMS to PowerBI:
Setting the Storage Mode property of tables to Import will import data into Power BI desktop, effectively increasing the model size. Configuring the Query reduction option Slicers or Filters settings has no effect on data model size.

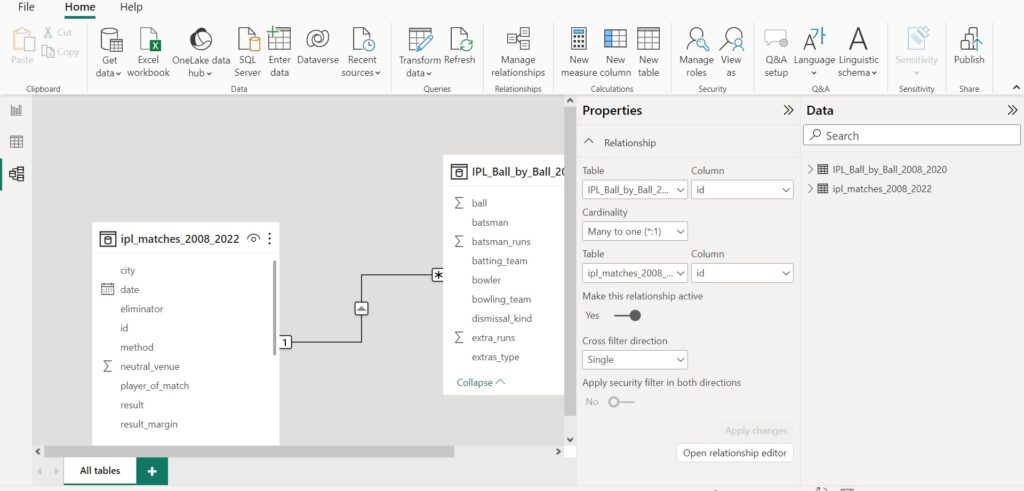
There is a many-to-one relationship between a fact table and dimension table. For each row in a dimension table there may be multiple matching rows in the fact table.
One-to-many and many-to-one cardinality are two common cardinality types, used for the relationships between a fact and dimension tables.
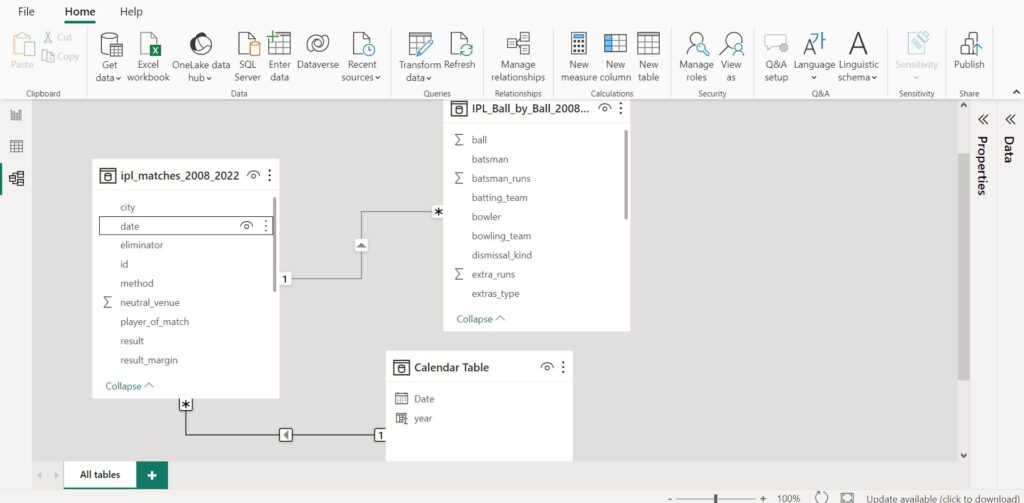
Adding a filter based on the year in the Filters pane would filter the values displayed in the visual, not remove a drilldown level. Adding a filter based on the quarter, month, and day in the Filters pane would filter the values displayed in the visual but would not prevent users from viewing the hierarchy based on the year.
Formatting chart elements:


DAX measure:
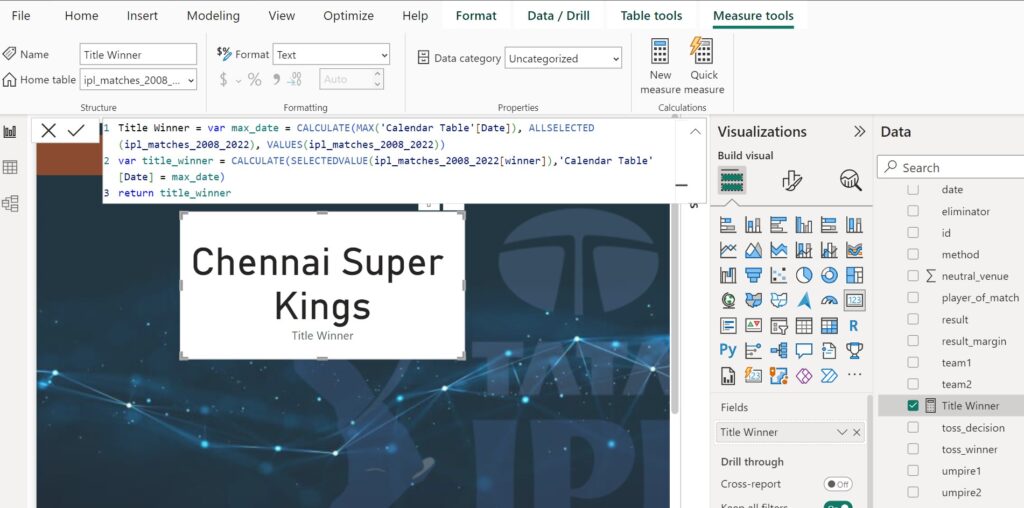
Title Winner = var max_date = CALCULATE(MAX('Calendar Table'[Date]), ALLSELECTED(ipl_matches_2008_2022), VALUES(ipl_matches_2008_2022))
var title_winner = CALCULATE(SELECTEDVALUE(ipl_matches_2008_2022[winner]),'Calendar Table'[Date] = max_date)
return title_winner
Configuring the Query reduction option Slicers or Filters settings has no effect on data model size.


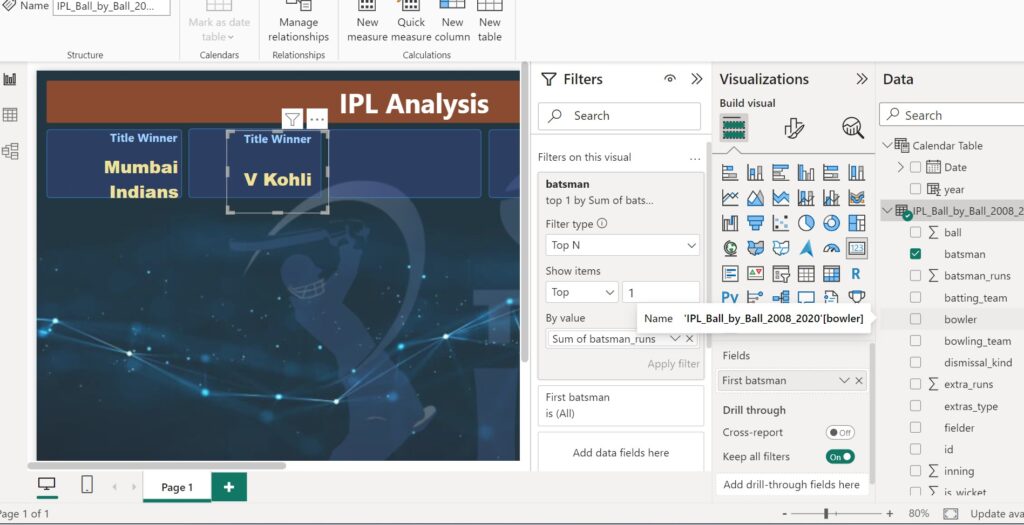
Only hiding the top 1 filter from the visual level filters in the filters pane will hide just this filter but allow other filters to show under the Filters on this visual icon.
A filter will show you the filtered data in this visual. Highlight is the default interaction between visuals. It shows you both the unfiltered and filtered values in the visual, for comparison purposes.
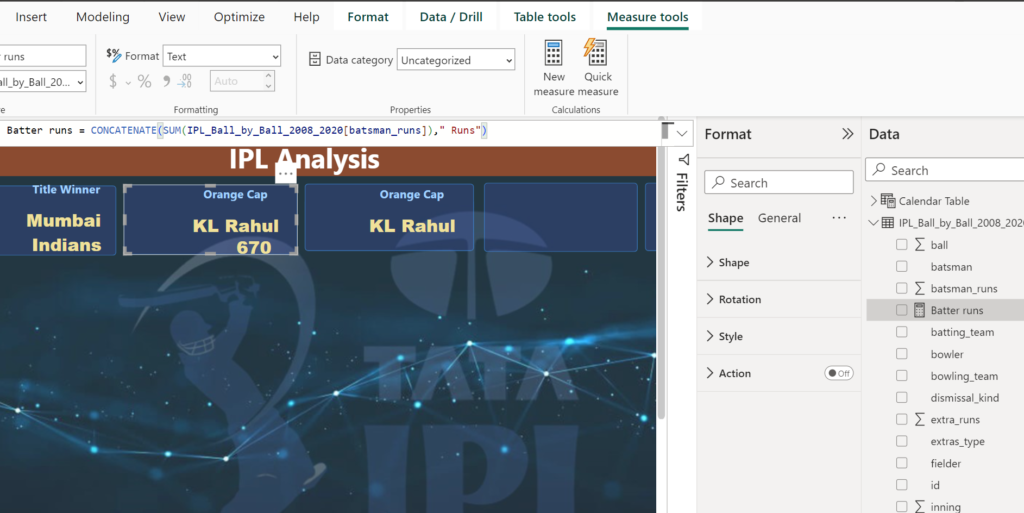
Batter runs = CONCATENATE(SUM(IPL_Ball_by_Ball_2008_2020[batsman_runs])," Runs")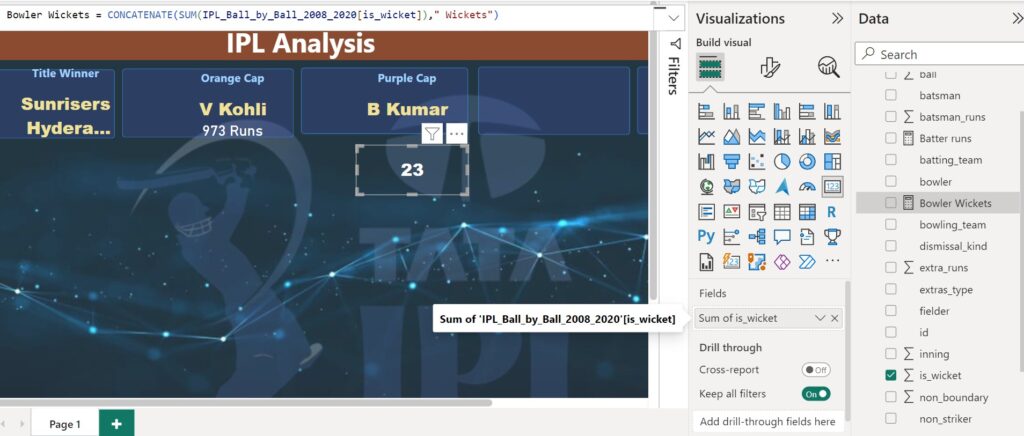
Bowler Wickets = CONCATENATE(SUM(IPL_Ball_by_Ball_2008_2020[is_wicket])," Wickets")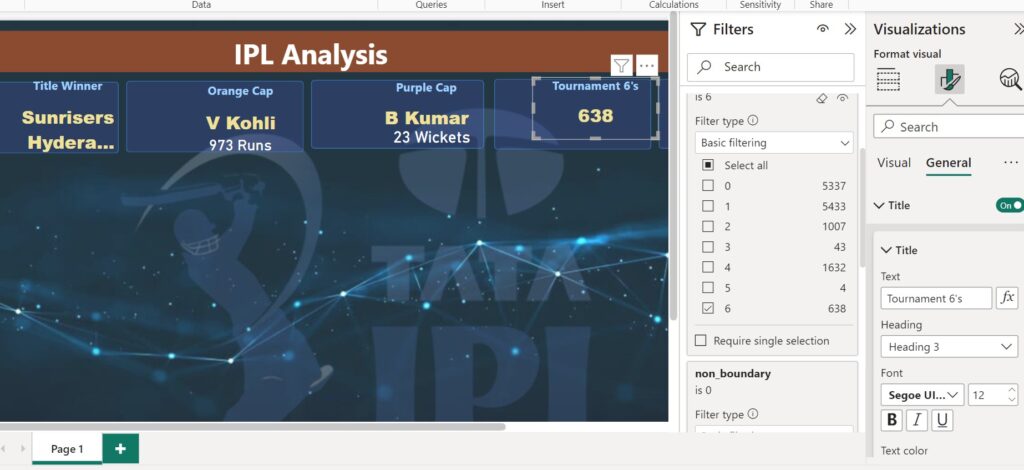
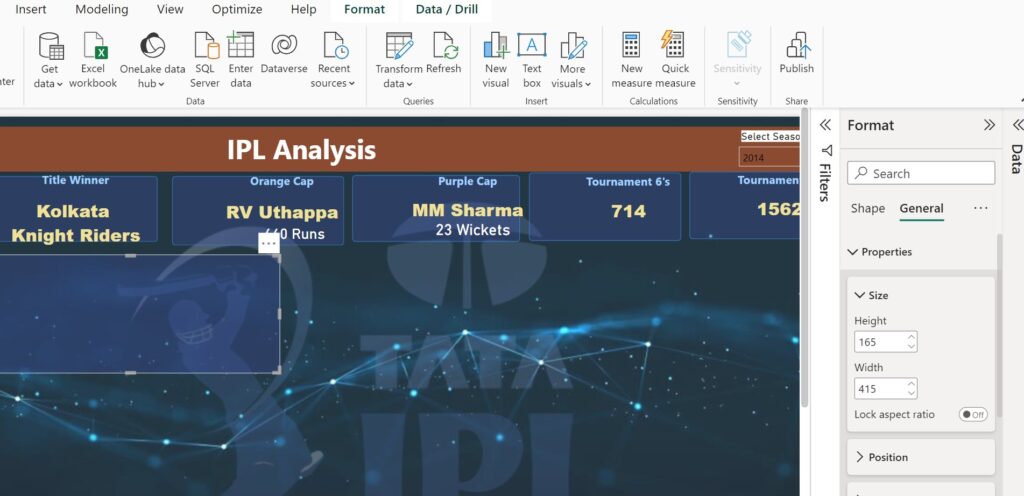
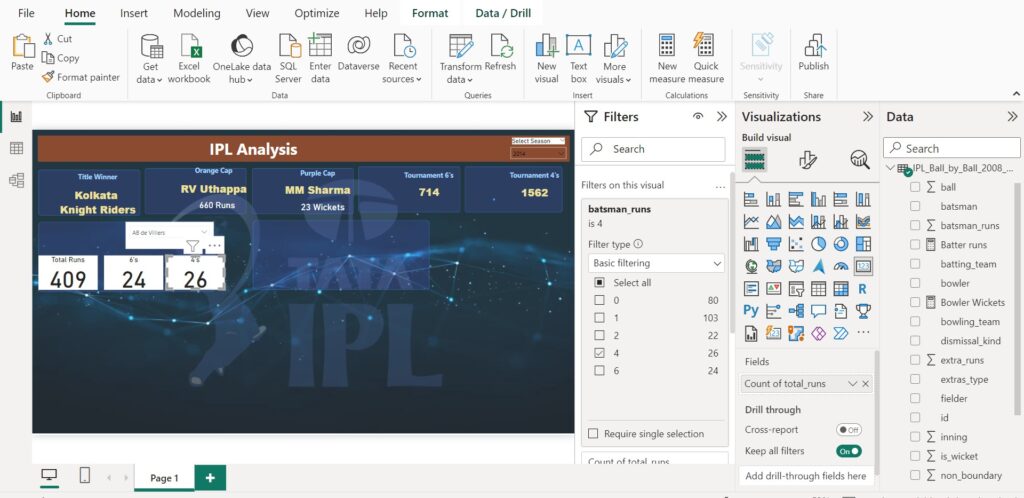
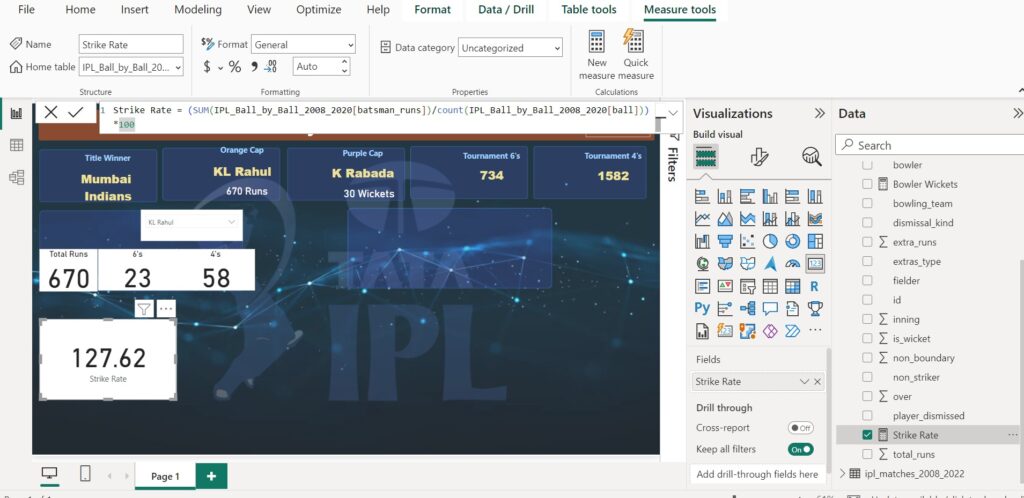
Strike Rate = (SUM(IPL_Ball_by_Ball_2008_2020[batsman_runs])/count(IPL_Ball_by_Ball_2008_2020[ball]))*100- SUM(IPL_Ball_by_Ball_2008_2020[batsman_runs]): This calculates the total number of runs scored by the batsman.
- count(IPL_Ball_by_Ball_2008_2020[ball]): This counts the total number of balls faced by the batsman.
- The two parts are then divided to get the average number of runs scored per ball.
- Finally, the result is multiplied by 100 to get the strike rate as a percentage.
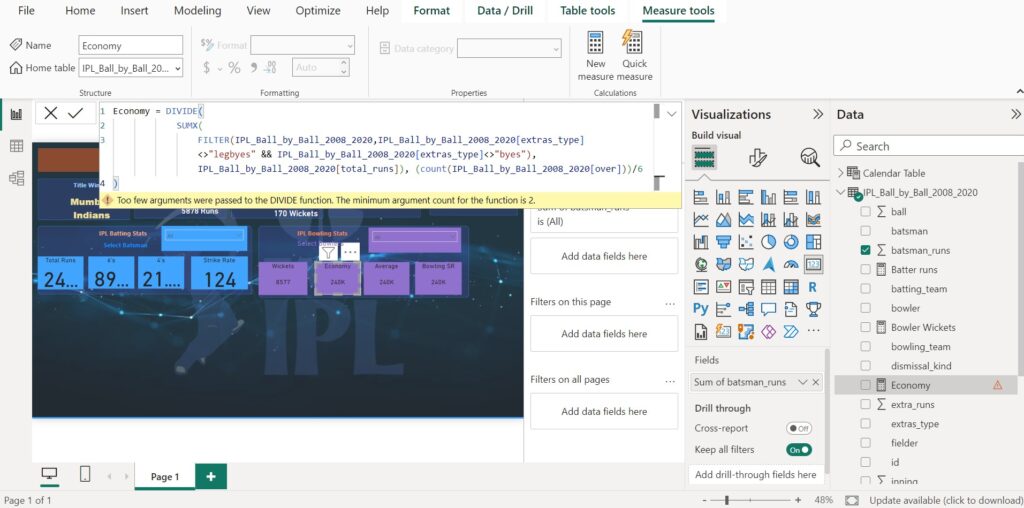
Economy = DIVIDE(
            SUMX(
                FILTER(IPL_Ball_by_Ball_2008_2020,IPL_Ball_by_Ball_2008_2020[extras_type]<>"legbyes" && IPL_Ball_by_Ball_2008_2020[extras_type]<>"byes"), IPL_Ball_by_Ball_2008_2020[total_runs]), (count(IPL_Ball_by_Ball_2008_2020[over]))/6
)- FILTER(IPL_Ball_by_Ball_2008_2020,IPL_Ball_by_Ball_2008_2020[extras_type]<>”legbyes” && IPL_Ball_by_Ball_2008_2020[extras_type]<>”byes”): This filters out any extras runs scored by the batting team, such as leg byes or byes.
- SUMX(): This calculates the total number of runs scored off the bowler’s deliveries after filtering out the extras.
- IPL_Ball_by_Ball_2008_2020[total_runs]: This is the column that contains the total runs scored off each delivery.
- count(IPL_Ball_by_Ball_2008_2020[over]): This counts the total number of overs bowled by the bowler.
- The two parts are then divided to get the average number of runs conceded per over.
- Finally, the result is divided by 6 to get the economy rate per over having 6 balls.
Average by bowler:
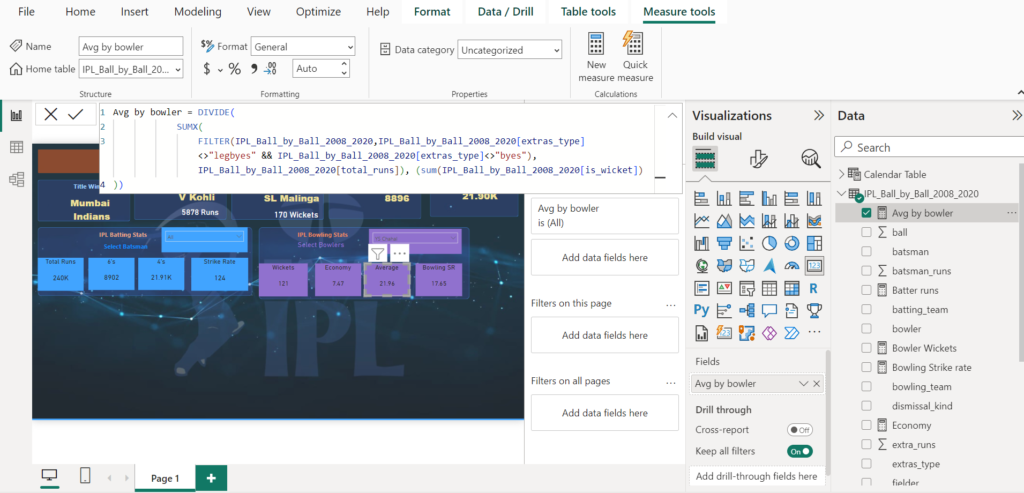
Avg by bowler = DIVIDE(
            SUMX(
                FILTER(IPL_Ball_by_Ball_2008_2020,IPL_Ball_by_Ball_2008_2020[extras_type]<>"legbyes" && IPL_Ball_by_Ball_2008_2020[extras_type]<>"byes"), IPL_Ball_by_Ball_2008_2020[total_runs]), (sum(IPL_Ball_by_Ball_2008_2020[is_wicket])
))- FILTER(IPL_Ball_by_Ball_2008_2020,IPL_Ball_by_Ball_2008_2020[extras_type]<>”legbyes” && IPL_Ball_by_Ball_2008_2020[extras_type]<>”byes”): This filters out any extra runs scored by the batting team, such as leg byes or byes.
- SUMX(): This calculates the total number of runs scored off the bowler’s deliveries after filtering out the extras.
- IPL_Ball_by_Ball_2008_2020[total_runs]: This is the column that contains the total runs scored off each delivery.
- sum(IPL_Ball_by_Ball_2008_2020[is_wicket]): This calculates the total number of wickets taken by the bowler.
- The two parts are then divided to get the average number of runs conceded per wicket taken.
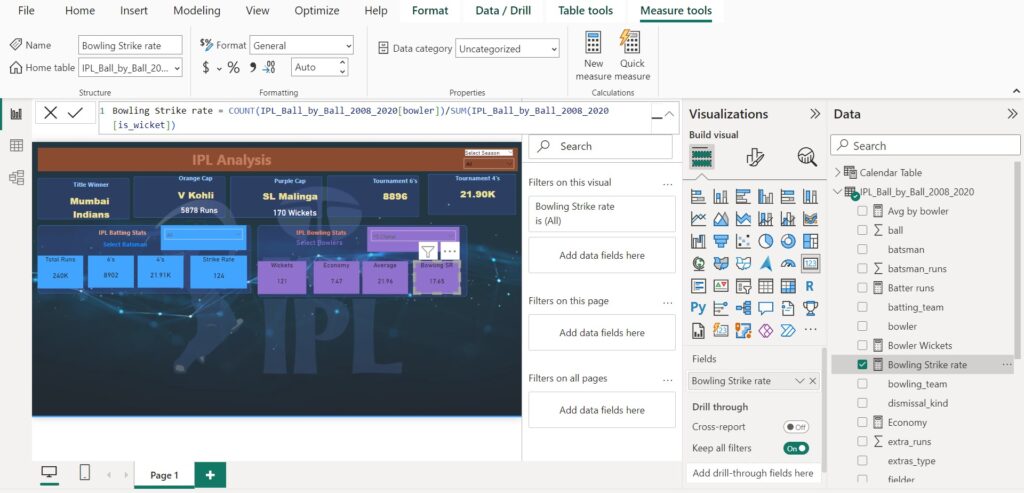
Bowling Strike rate = COUNT(IPL_Ball_by_Ball_2008_2020[bowler])/SUM(IPL_Ball_by_Ball_2008_2020[is_wicket])- COUNT(IPL_Ball_by_Ball_2008_2020[bowler]): This counts the total number of balls bowled by the bowler.
- SUM(IPL_Ball_by_Ball_2008_2020[is_wicket]): This calculates the total number of wickets taken by the bowler.
- The two parts are then divided to get the average number of balls bowled per wicket taken.
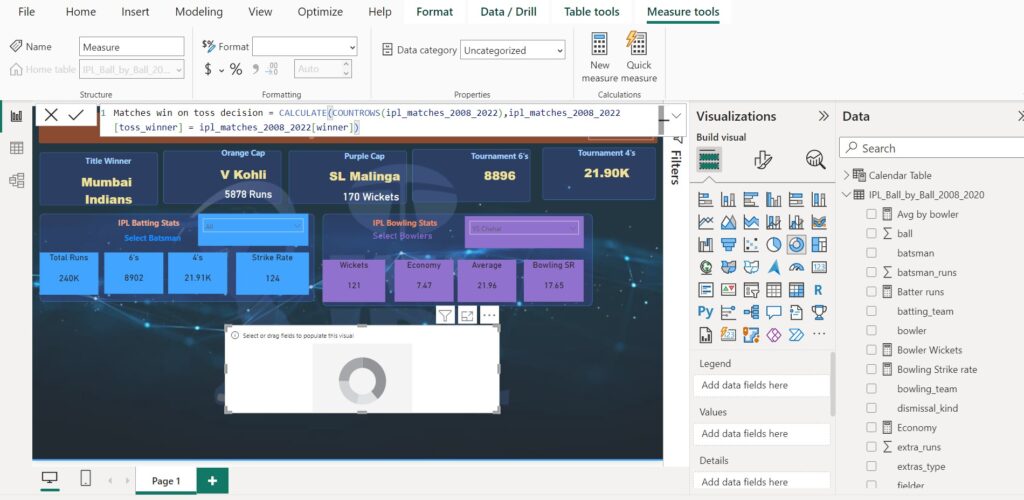
Matches win on toss decision = CALCULATE(COUNTROWS(ipl_matches_2008_2022),ipl_matches_2008_2022[toss_winner] = ipl_matches_2008_2022[winner])- COUNTROWS(ipl_matches_2008_2022): This counts the total number of rows in the IPL matches dataset.
- ipl_matches_2008_2022[toss_winner]: This is the column that contains the name of the team that won the toss.
- ipl_matches_2008_2022[winner]: This is the column that contains the name of the team that won the match.
- The formula filters the dataset to only include rows where the toss winner is the same as the match winner.
- The filtered dataset is then counted to get the total number of matches won on toss decision.
Online publishing:

Recent Comments