Descriptive vs Inferential:
Descriptive: everyday happenings such as accidents, prices of goods, business, incomes, epidemics, sports data, population data.
Inferential: uses mathematical tools to make forecasts and projections by analyzing the given data
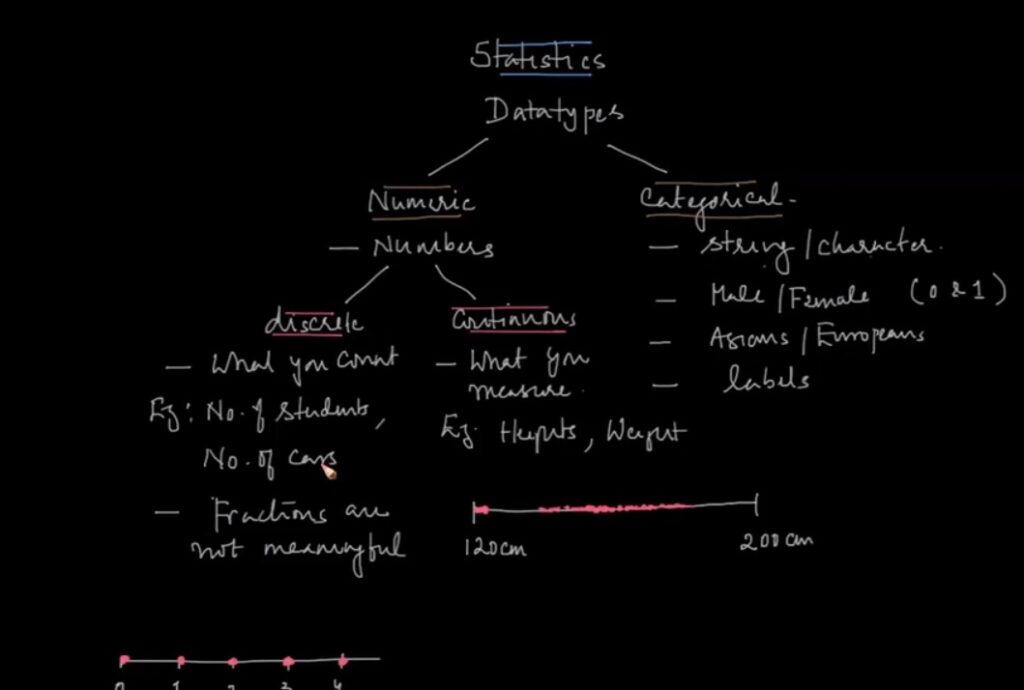
Datatypes:
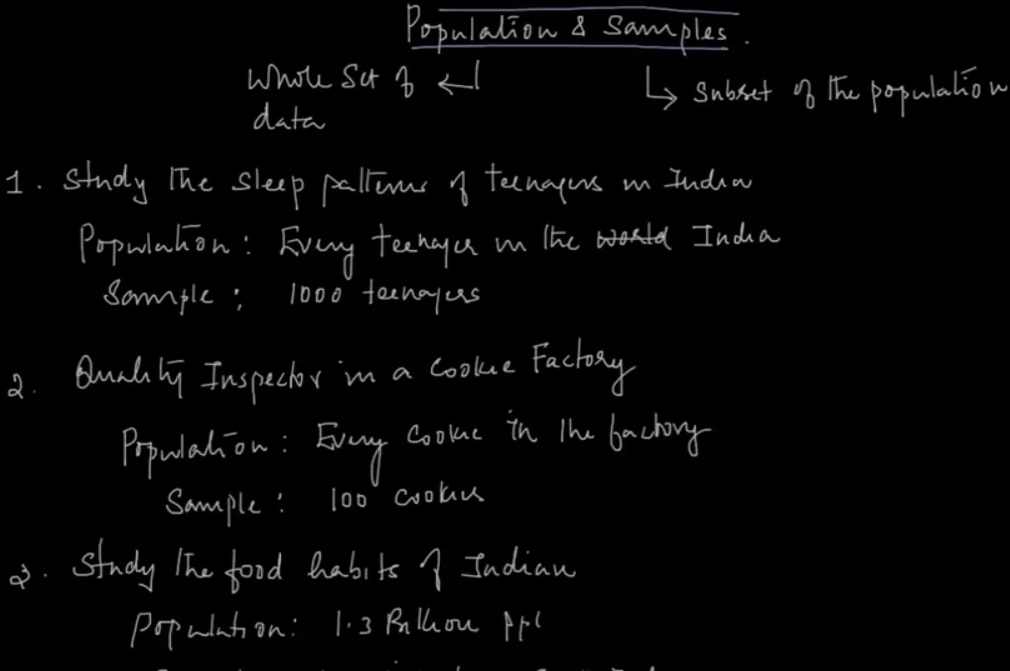
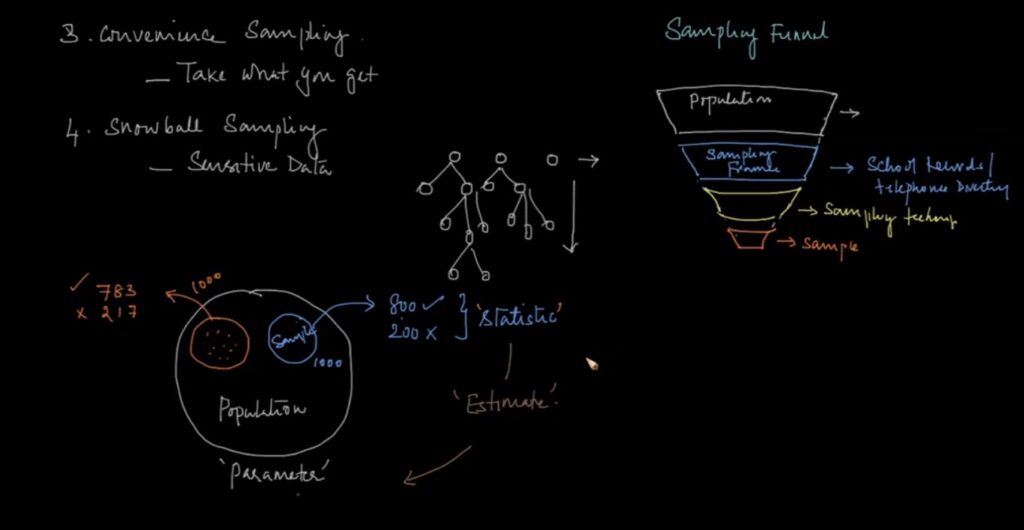
Population and samples:
Types of statistics:
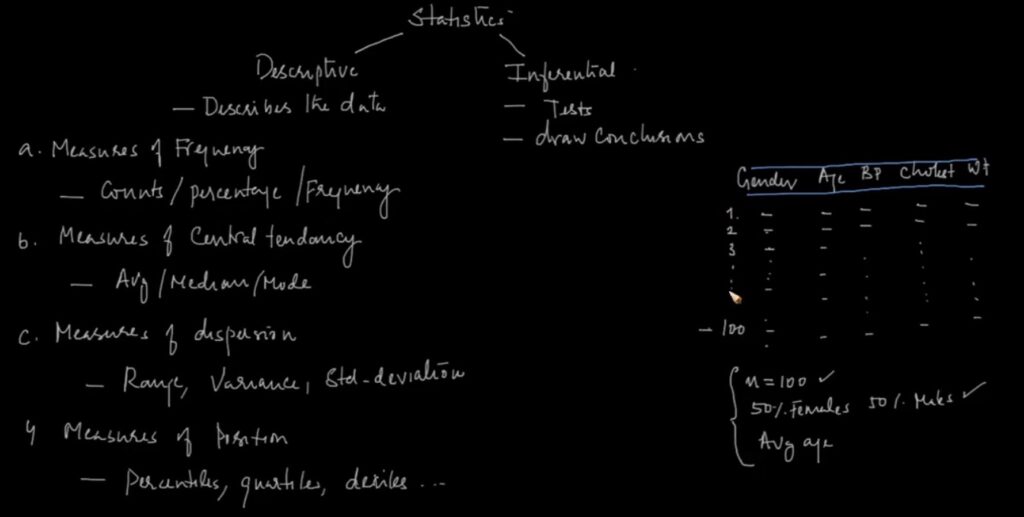
Measures of central tendency:
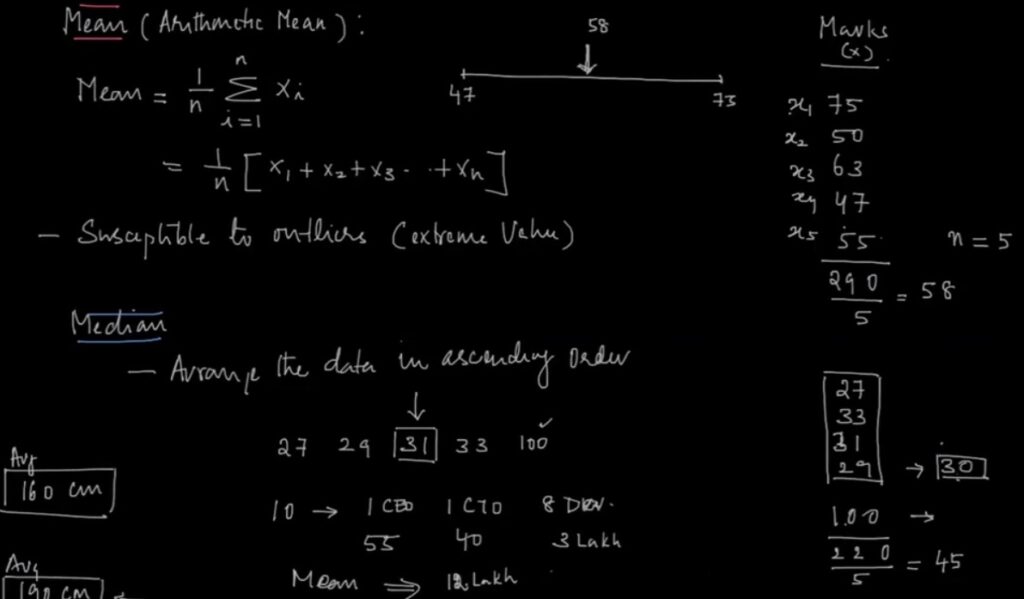
These are ways of describing the central position of a frequency distribution for a group of data. In the case of, distribution or spread of the marks the frequency distribution is simply the distribution and pattern of marks scored by the 100 students records from the lowest to the highest. This central position using the mode, median, and mean.
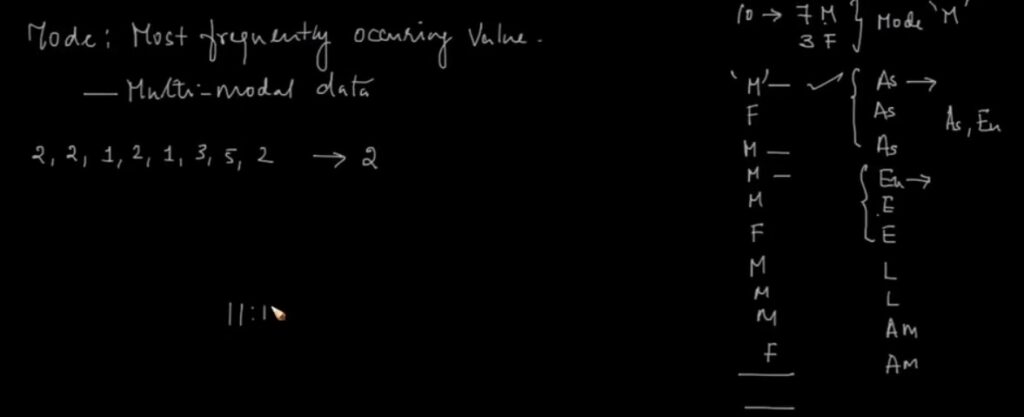
Mode helps identify the most common or frequent occurrence of a characteristic. For example the administrator measured the power consumption of an entire network operations center (NOC) and the set of numbers is 90 W, 104 W, 98 W, 98 W, 105 W, 92 W, 102 W, 100 W, 110 W, 98 W, 210 W and 115 W. The mode is 98 W
Measures of dispersion:
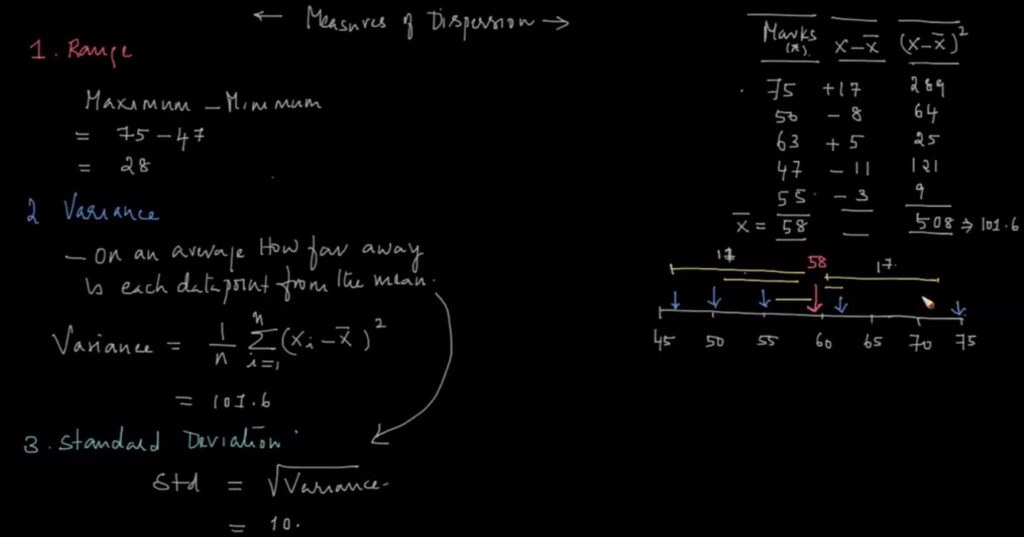
To describe measures of spread, a number of statistics are available to us, including the range, quartiles, absolute deviation, variance and standard deviation.
For example, the mean score of our 100 students may be 65 out of 100. However, not all students will have scored 65 marks. Rather, their scores will be spread out. Some will be lower and others higher. Measures of spread help us to summarize how spread out these scores are.

The range can be articulated as simply listing the lowest to highest value (i.e. range of 2 – 10).The variance is the average difference of each value in the sample from the mean. The standard deviation is simply the square root of the variance.
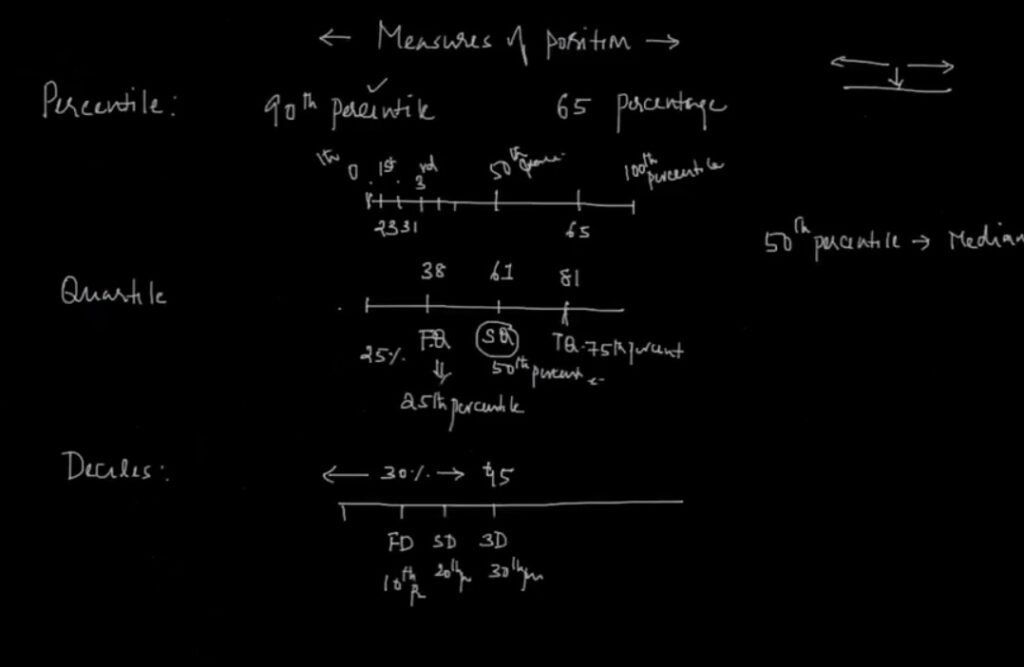
Measures of position:
Recent Comments