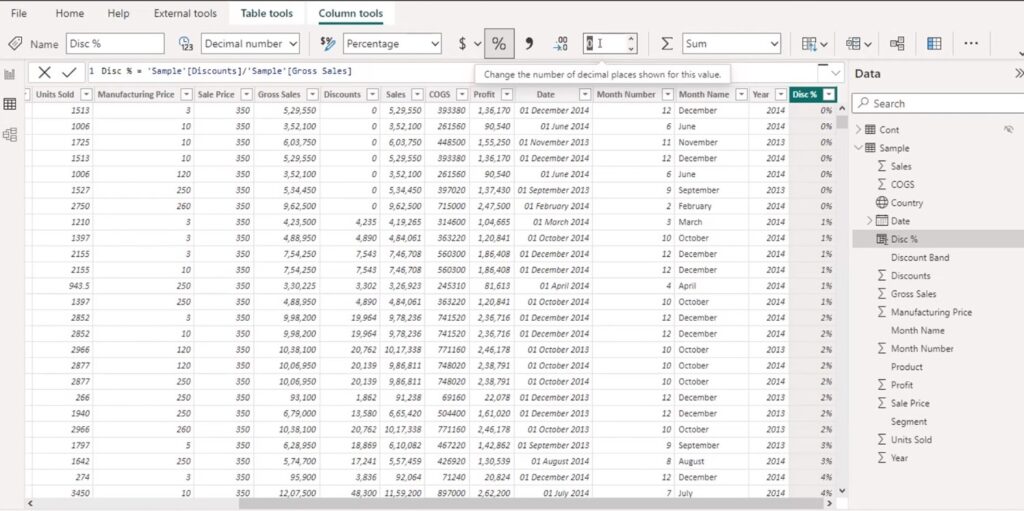
Dax expression:
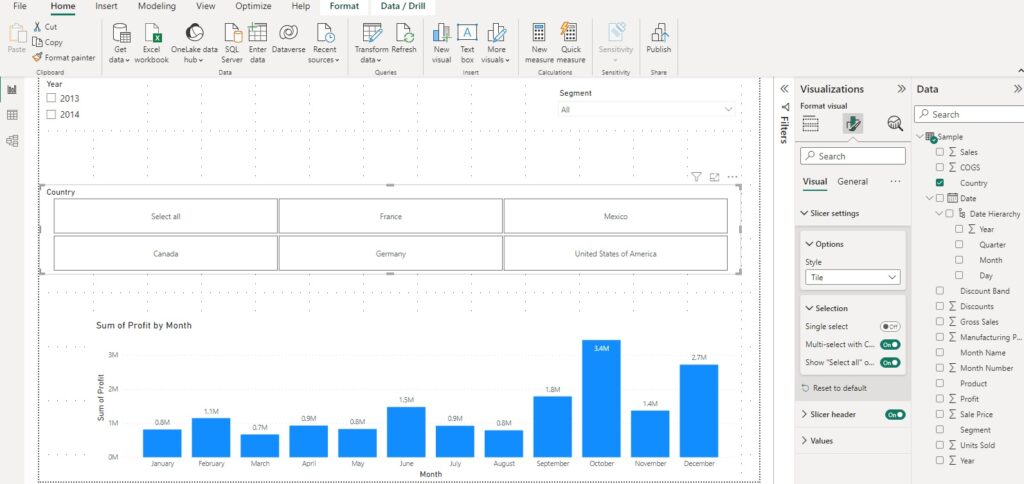
Slicer:
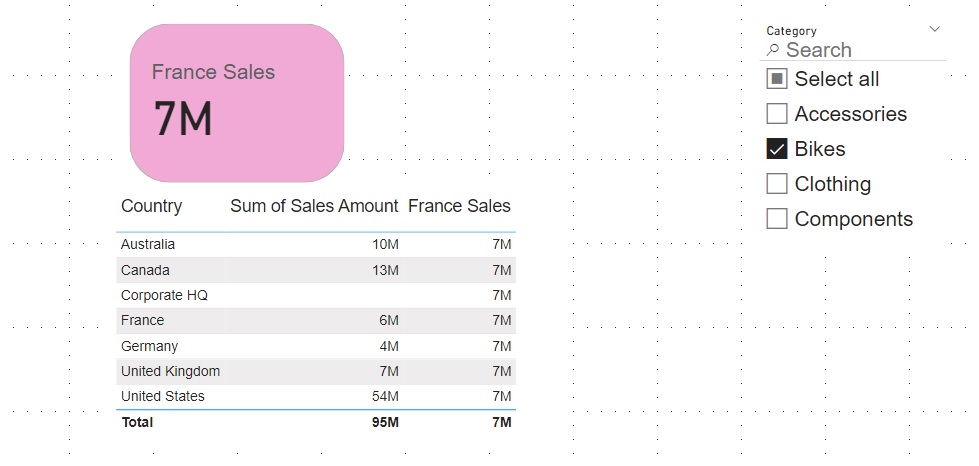
To exclude row by row in slicer
France Sales = calculate(sum(Sales_data[Sales Amount]),
‘Sales Territory_data'[Country] = “France”,
ALL(Sales_data))
Non_france aus sales = CALCULATE(SUM(‘Sales_data'[Sales Amount]),
NOT(‘Sales Territory_data'[Country] in {“Australia”, “france”}))
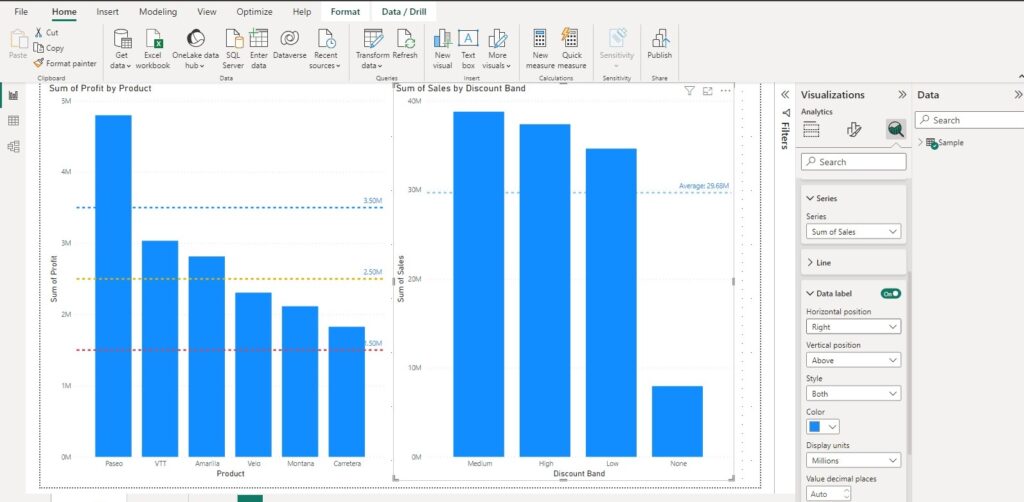
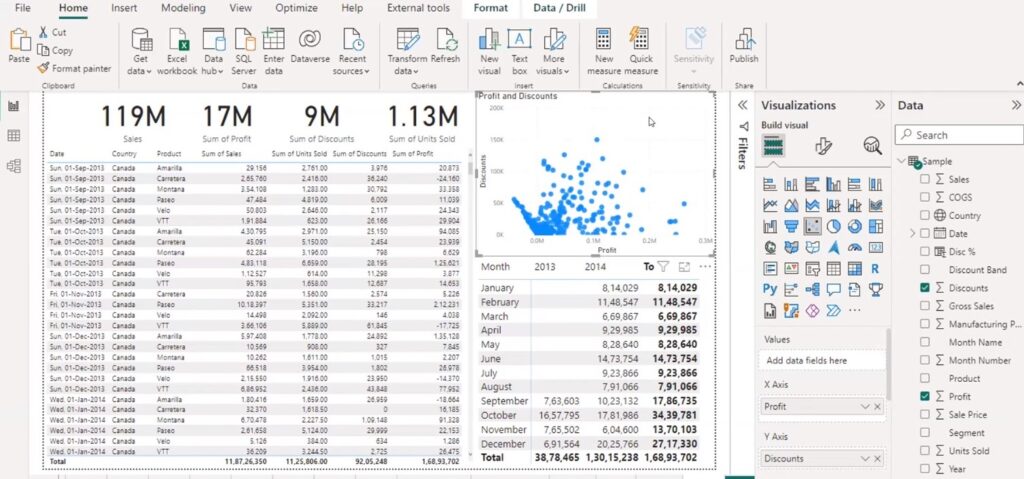
Reference Line:
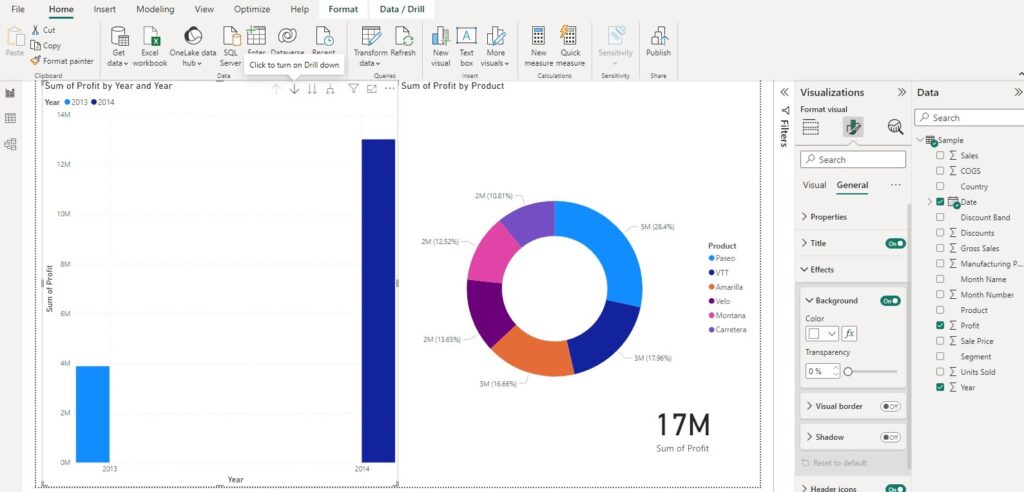
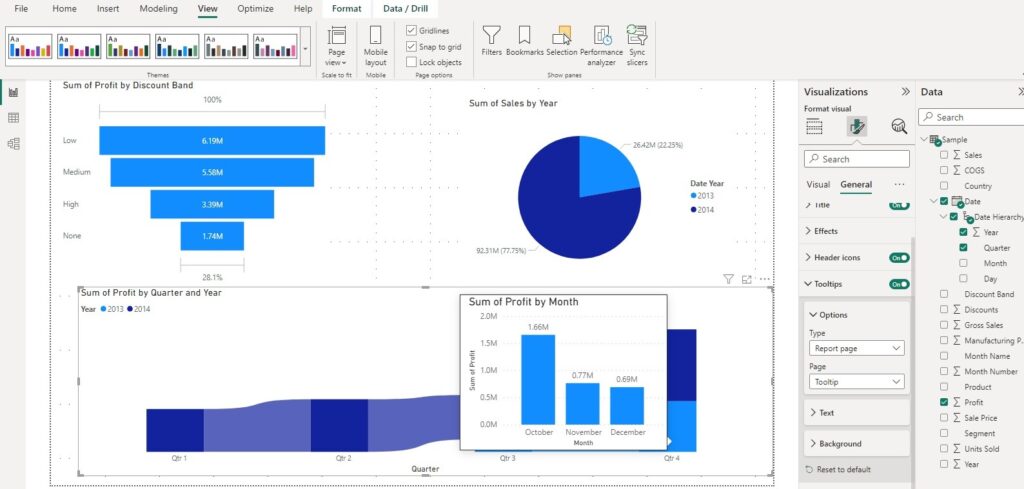
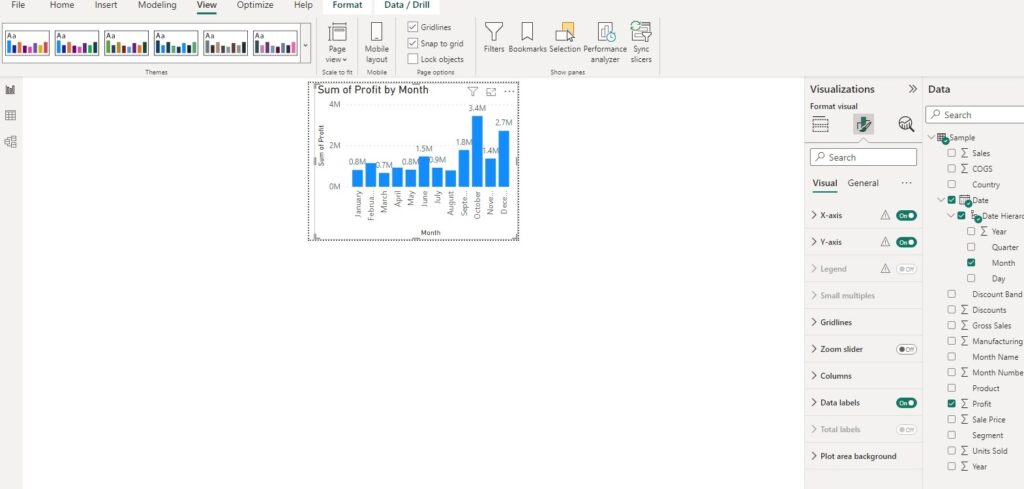
Drilldown:
Dynamic Formatting of strings:
Slicer for controlled output:
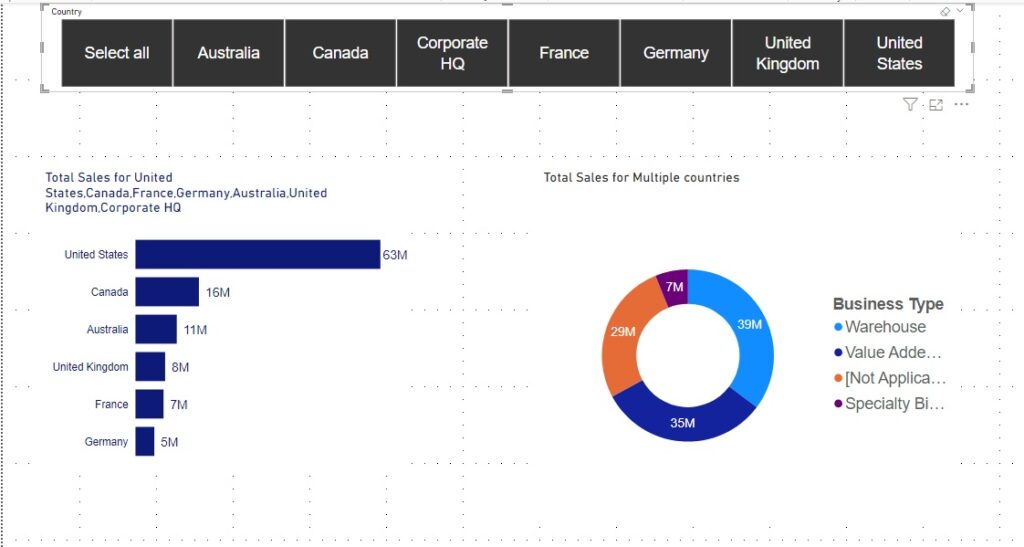
Selected Country sales =
Var S = SELECTEDVALUE(‘Sales Territory_data'[Country], “Multiple countries”)
RETURN
“Total Sales for ” & S
Slicer does not affect the total sales of the country.
m_multiplecountries =
var M = concatenateX(VALUES(‘Sales Territory_data'[Country]),
‘Sales Territory_data'[Country], “,” )
return
“Total Sales for ” & M
Cross filter functions:
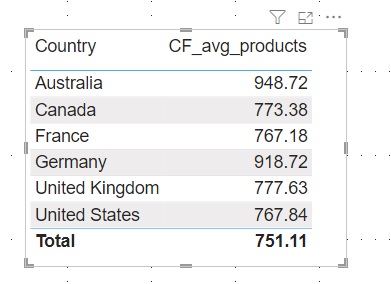
CF_avg_products =
CALCULATE(AVERAGE(Product_data[List Price]),
CROSSFILTER(Sales_data[ProductKey],Product_data[ProductKey], Both))CROSSFILTER function: Specifies the cross-filtering direction between the Sales_data and Product_data tables.Both: The cross-filter direction to be used. Filters on either side filters the other side.
Power Query column calculation:
Selecting only 2 countries sales:
france aus sales = CALCULATE(SUM(‘Sales_data'[Sales Amount]),
(‘Sales Territory_data'[Country] in {“Australia”, “france”}))
RETURN
“Total Sales for ” & S
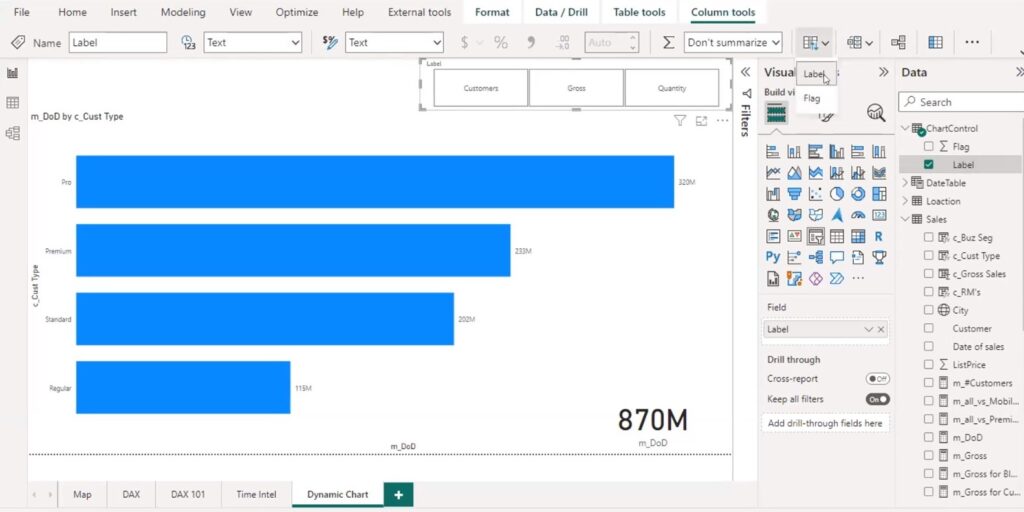
Dynamic chart selection:
Tool tip:
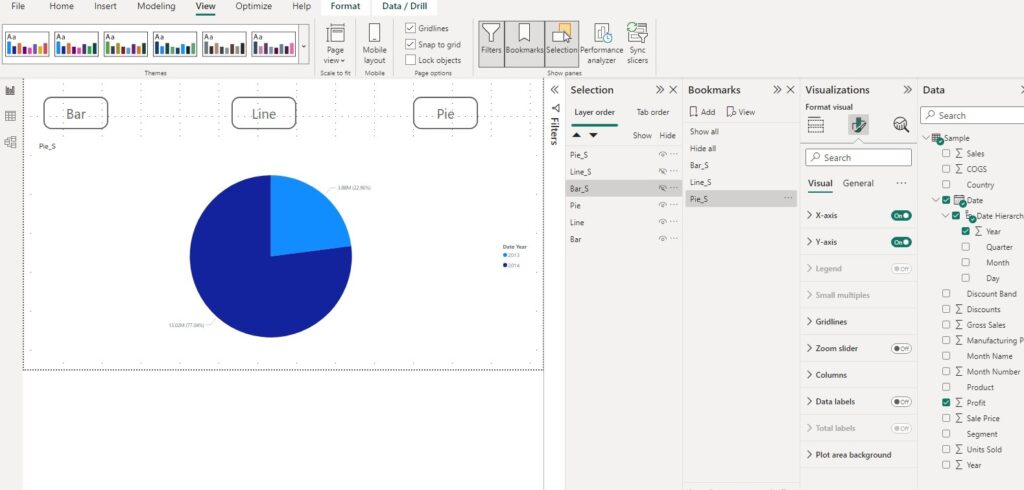
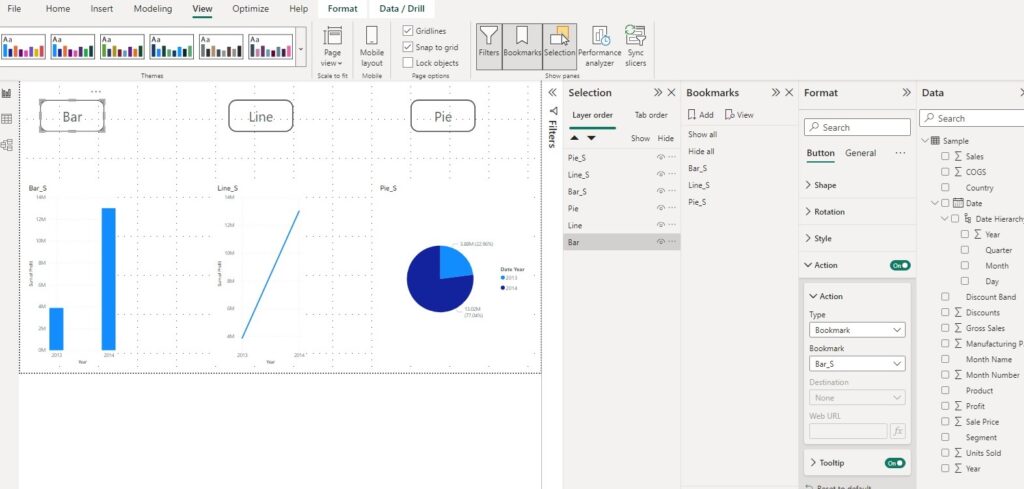
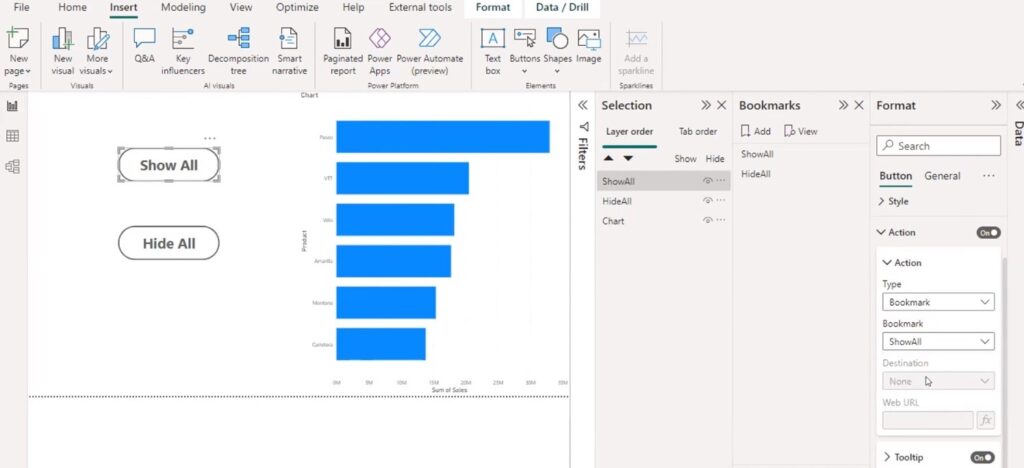
Bookmark:
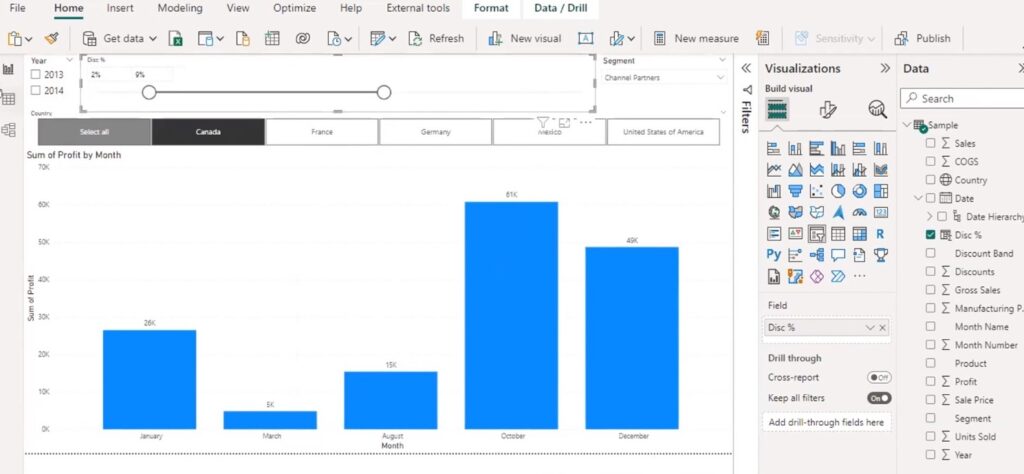
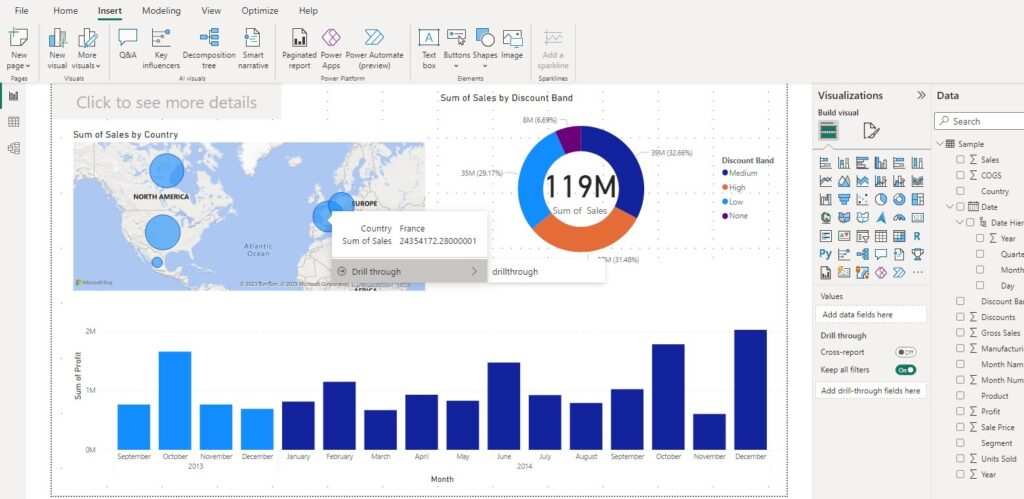
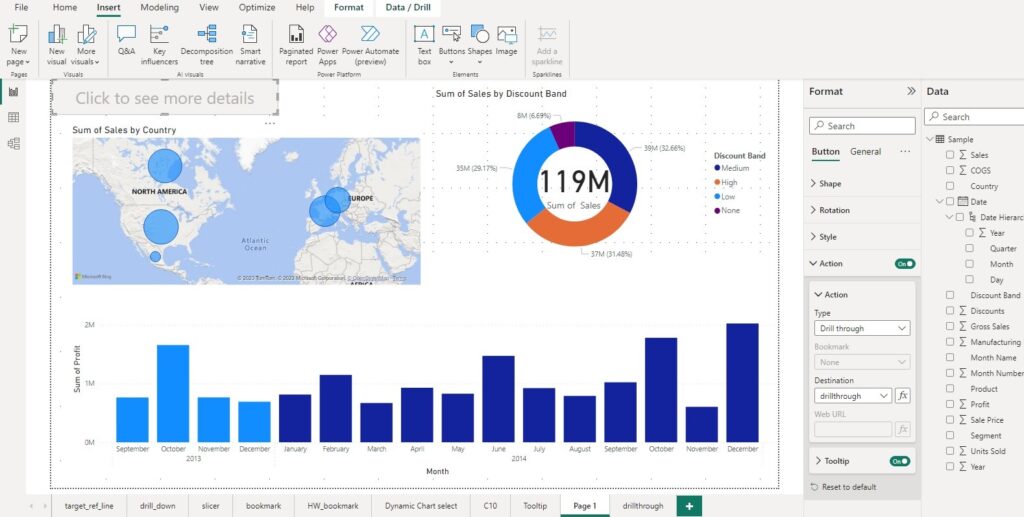
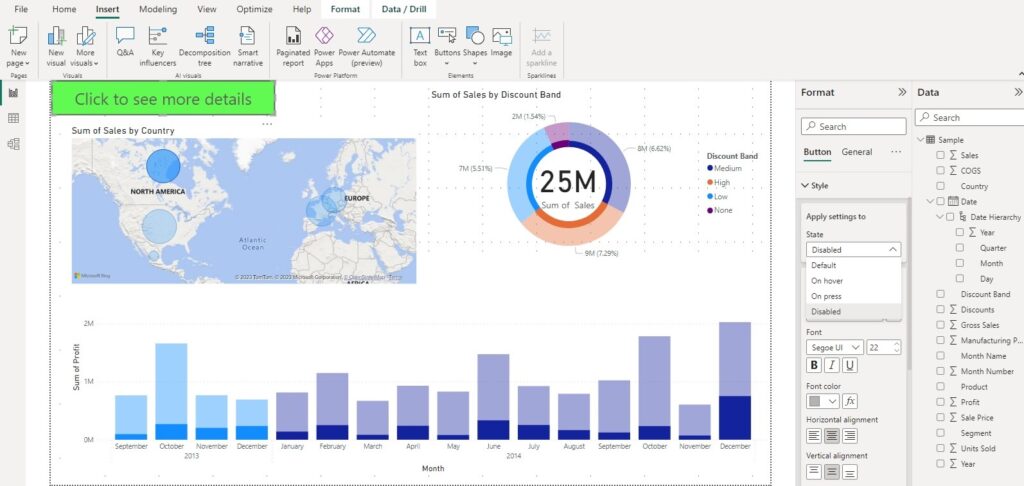
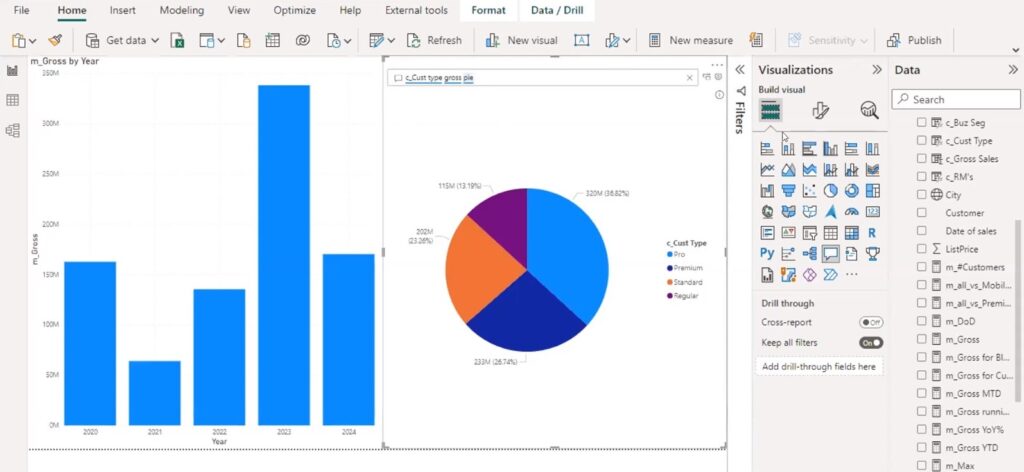
Drillthrough:
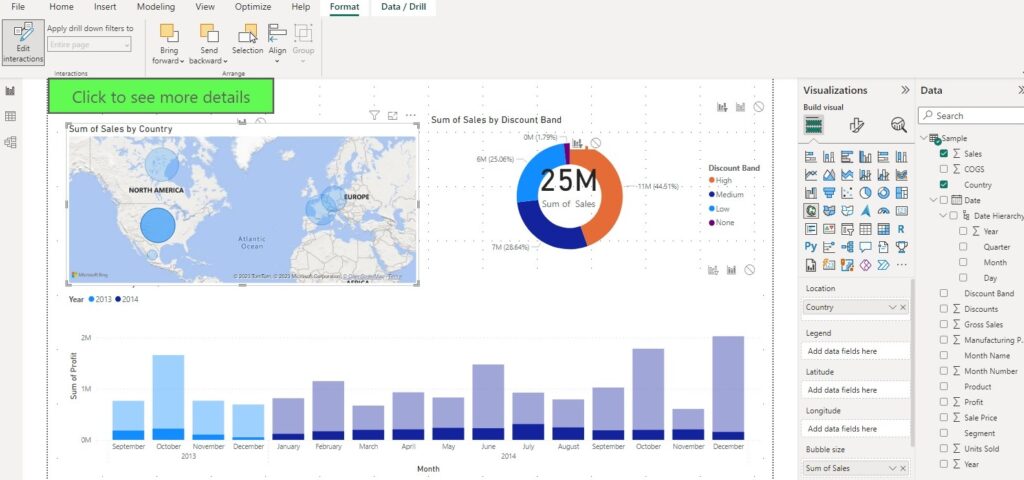
Edit interactions of the map for Relative filter:
Slicer for page level and
Edit interaction for visual level filter.
Edit interactions of the map for absolute filter:
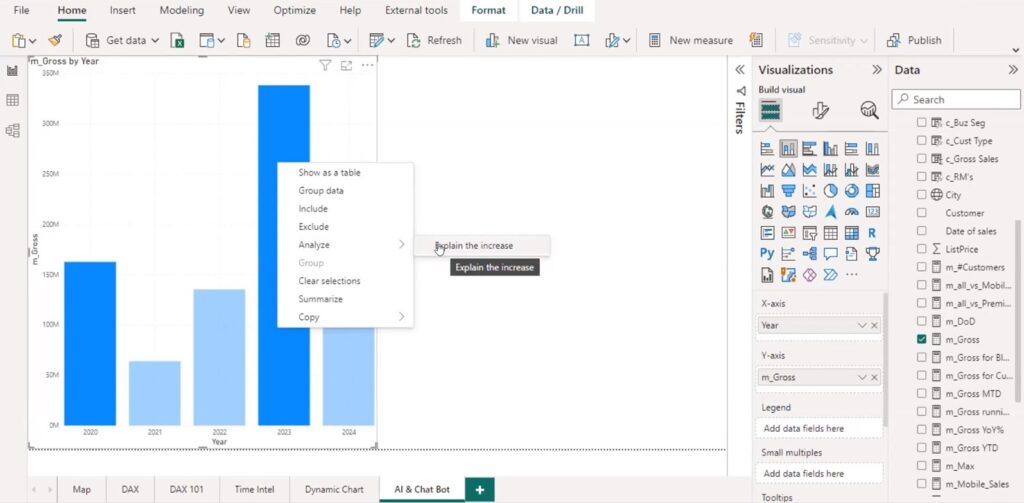
AI graph analysis:
Q and A graph:
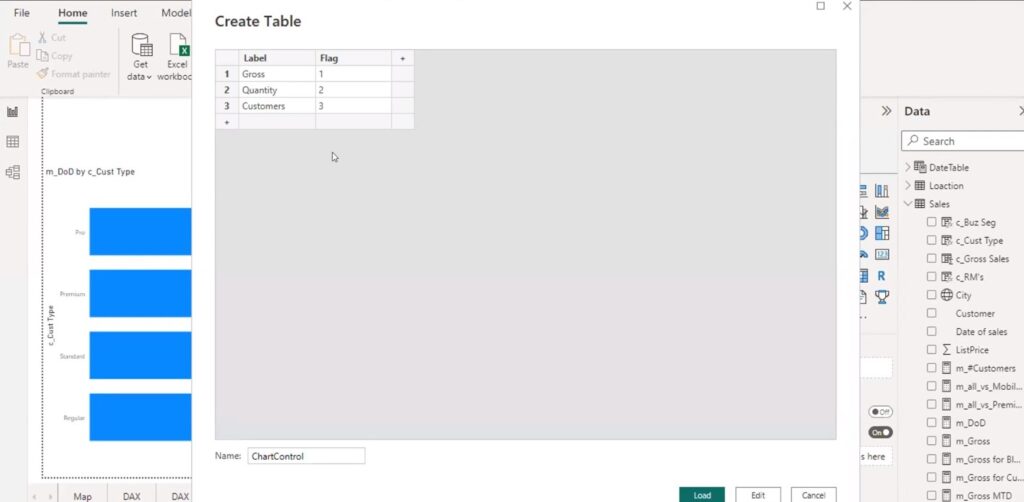
Custom visual by creating a table:
Tiled buttons with switch DAX function:
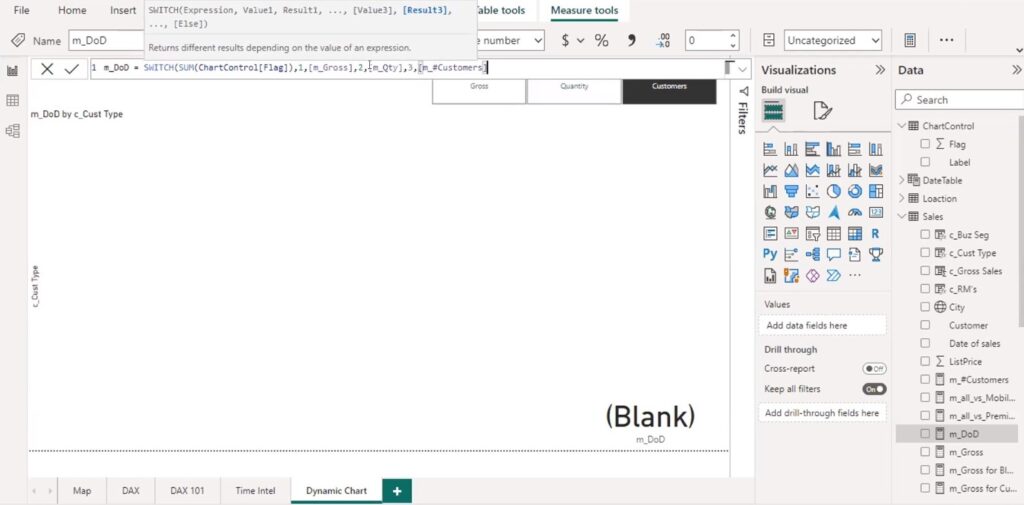
Dynamic chart based on button measure:
Formatting in crores:
m_Revenue in Cr = CONCATENATE(
    FORMAT(DIVIDE([mRevenue], 10000000), "0.00"), " Cr"
    )
Recent Comments