Donut chart:
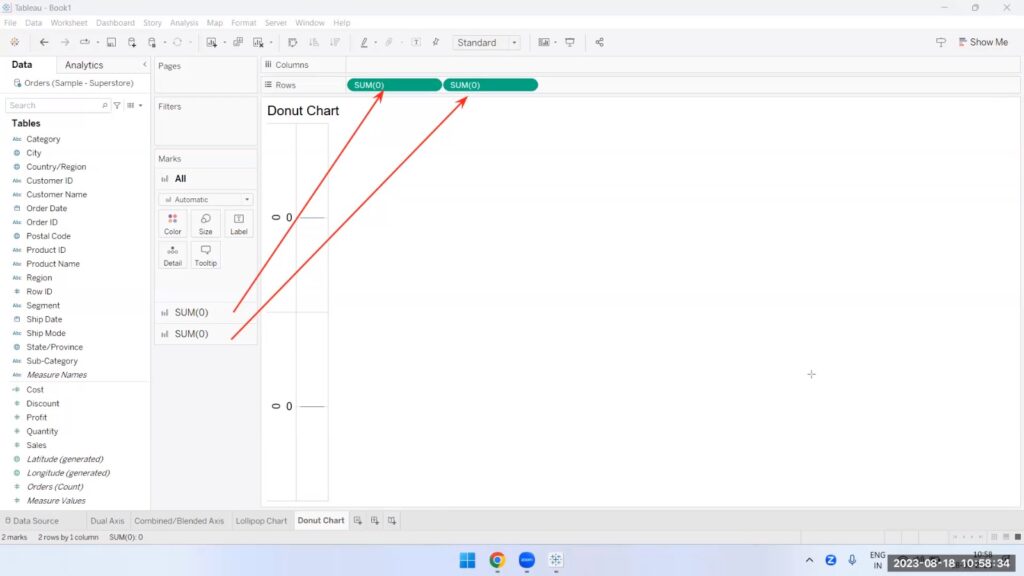
Step:2
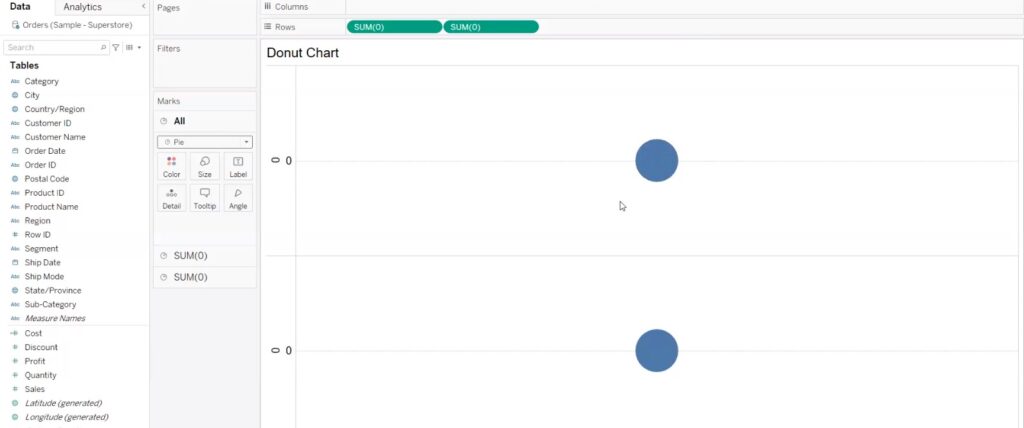
Step:3
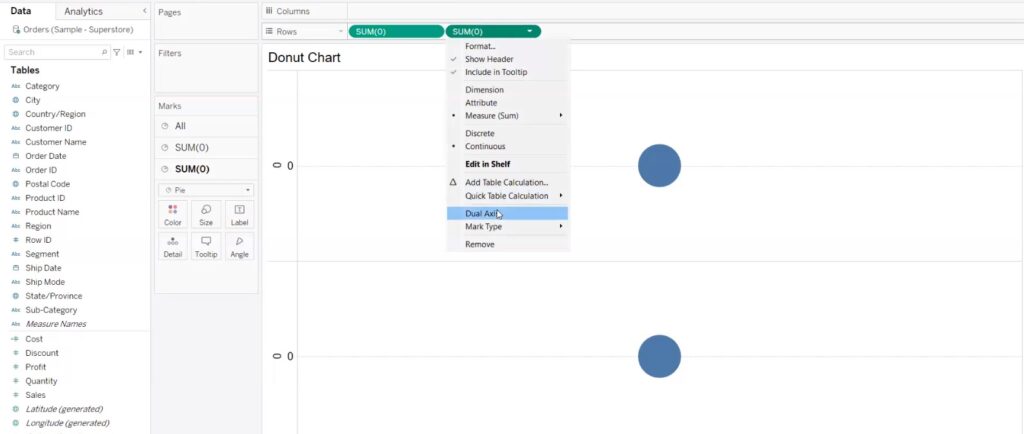
Step:4
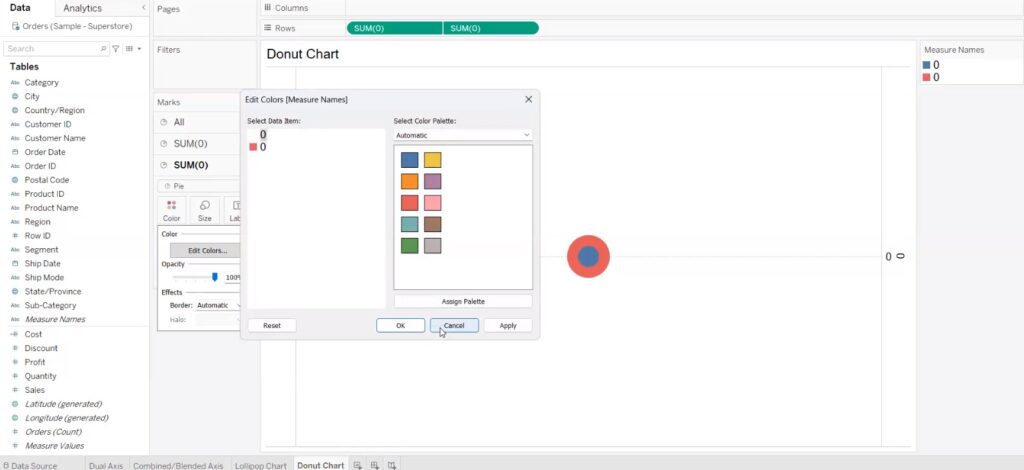
Step:5
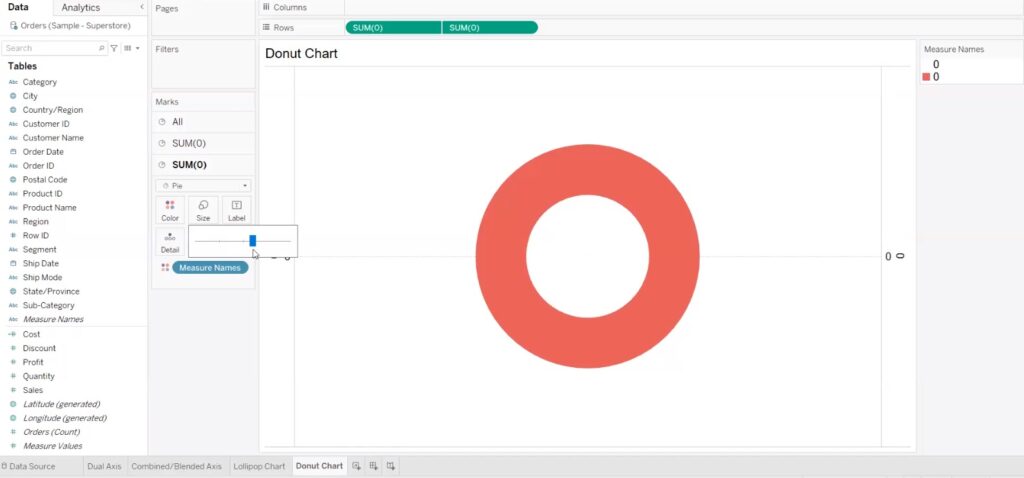
Step:6
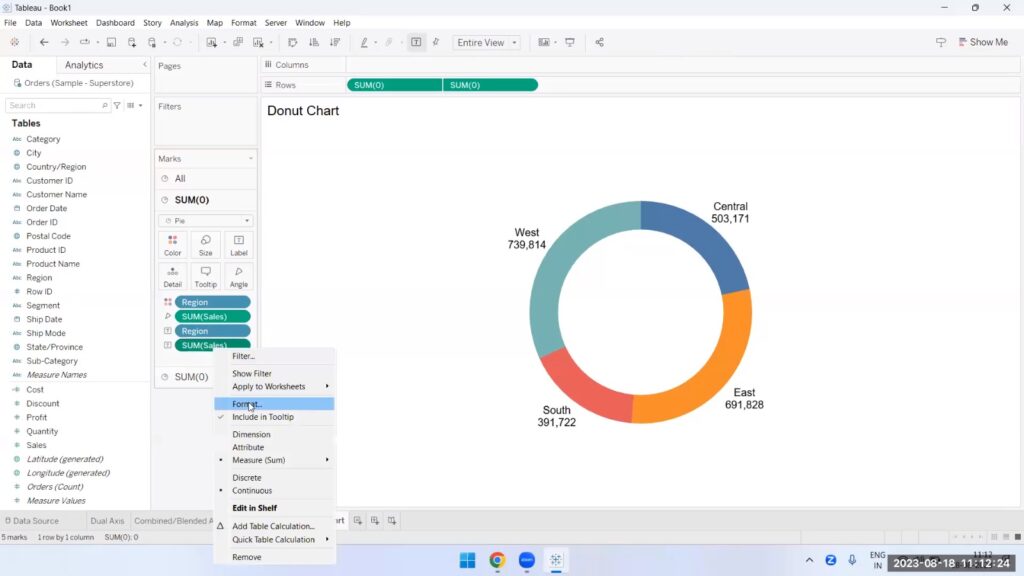
Step:7
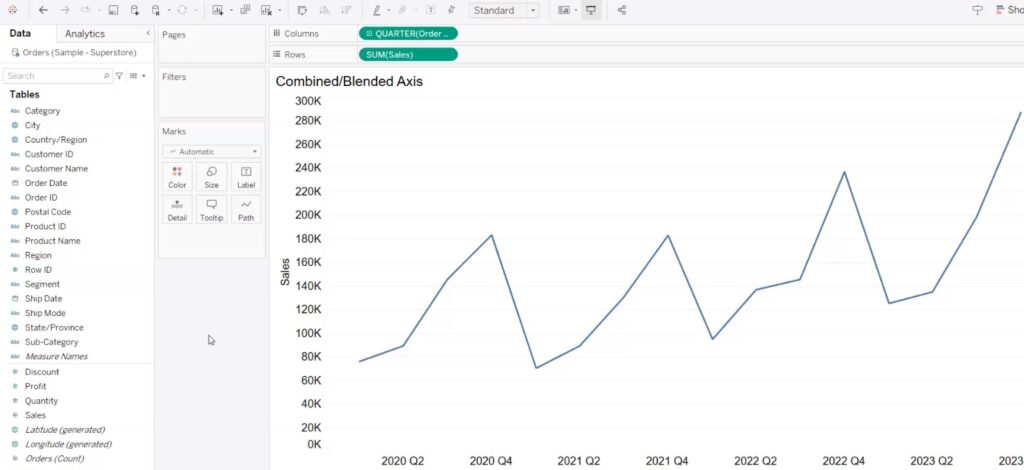
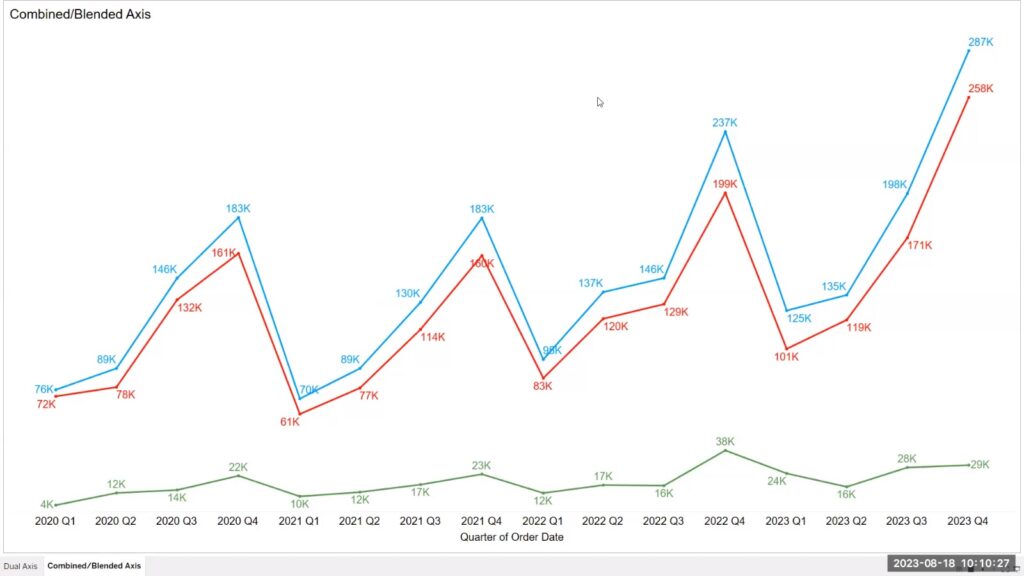
What is the difference between dual axis and blended axis:
Blended axis Or Combined axis or Shared Axis chart-All are the same
A shared axis chart in Tableau is that shares one axis among multiple measures. This chart can be used when the measures have similarly ranged values and can be presented using one mark and one scale.
Note: A dual axis chart can show only two measures where as shared axis charts is usefull to show more than two measures.
Dual axis chart creates separate marks for each measure but in shared axis will have only one mark.
Blended axis:
Sales:
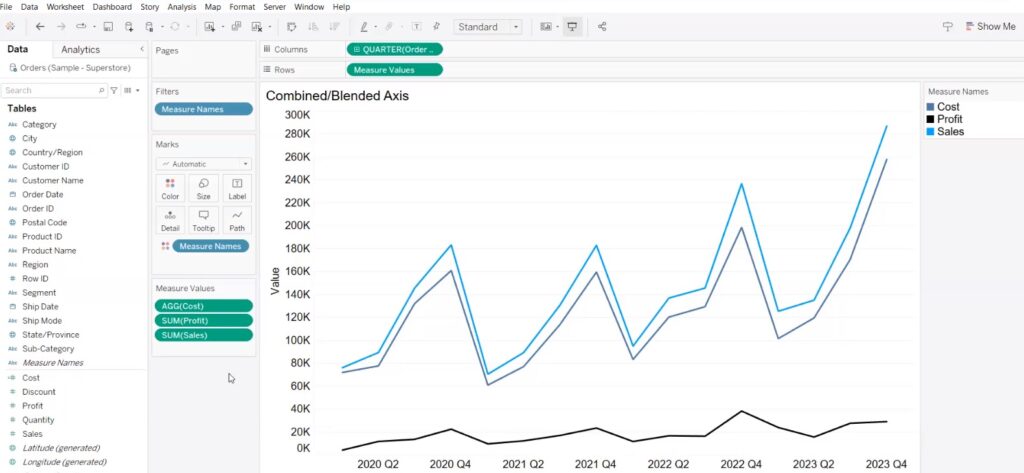
Cost:
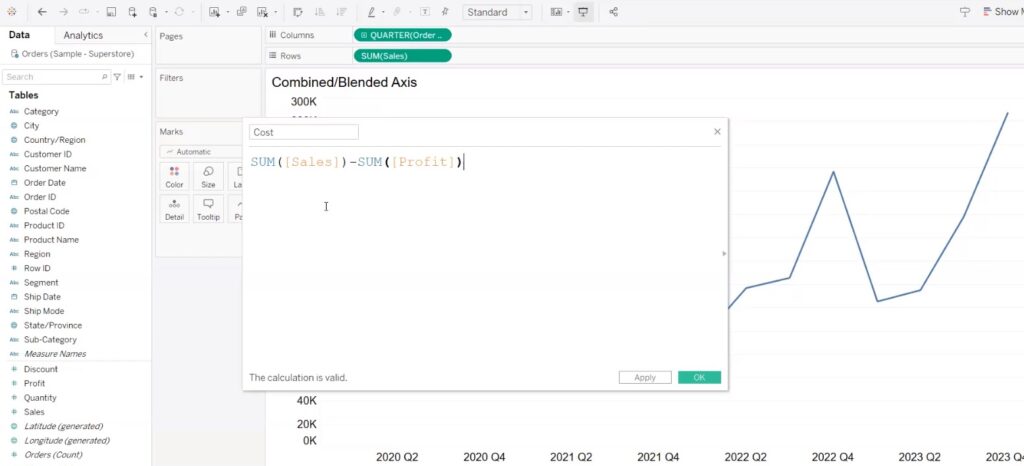
Profit:
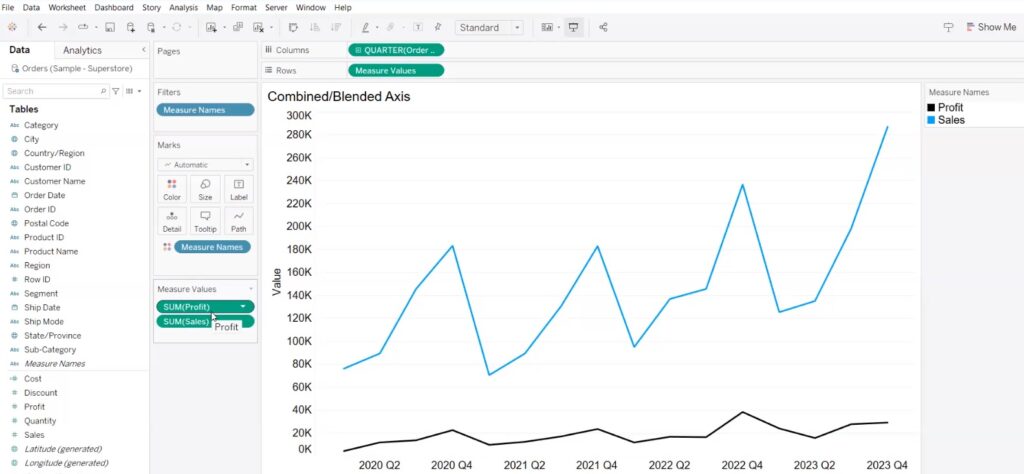
Blended axis:
Proper formatting:
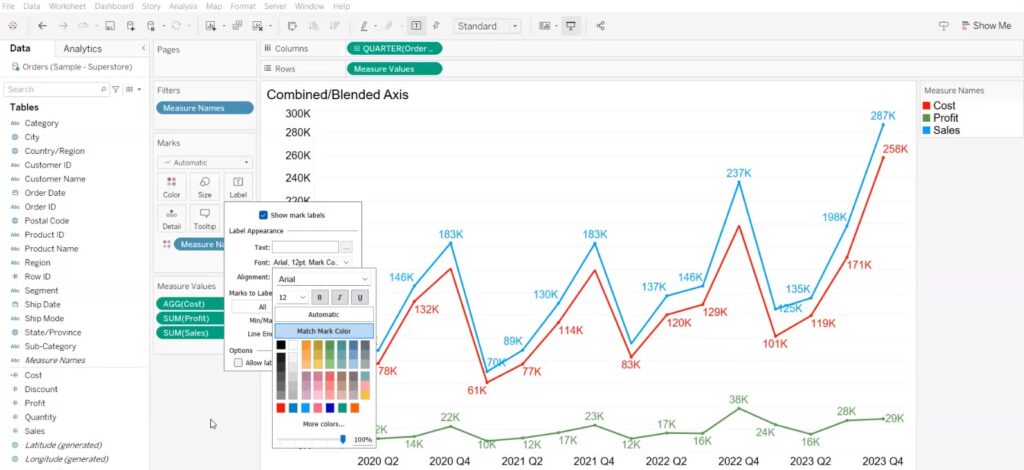
Blended Final output:
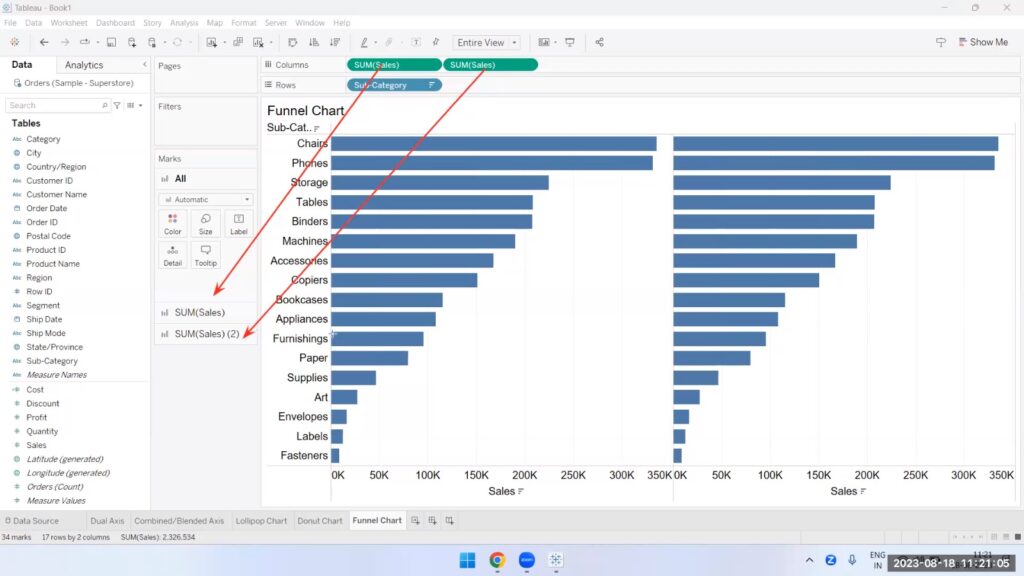
Funnel chart:
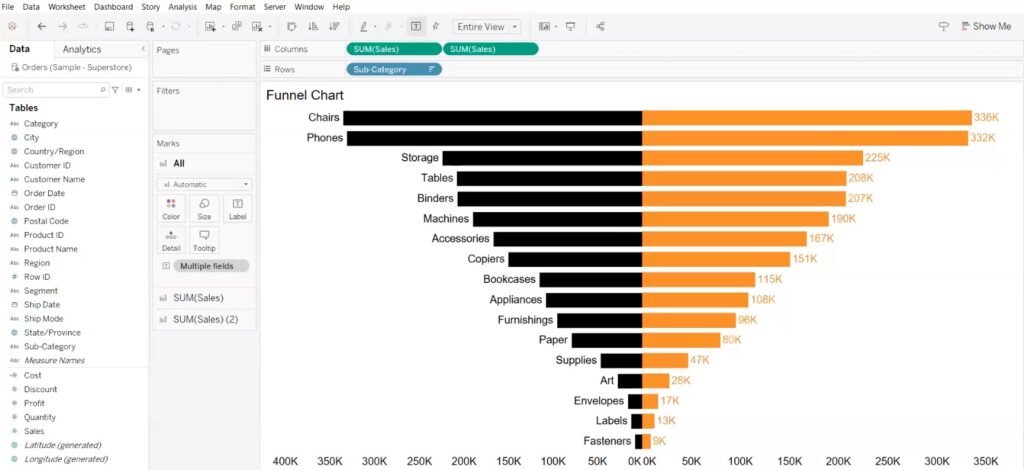
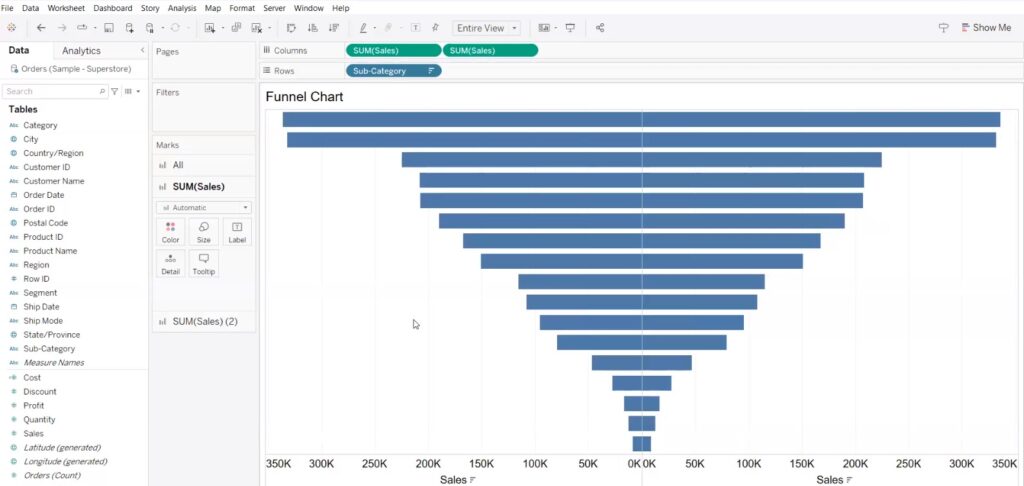
Step-1:
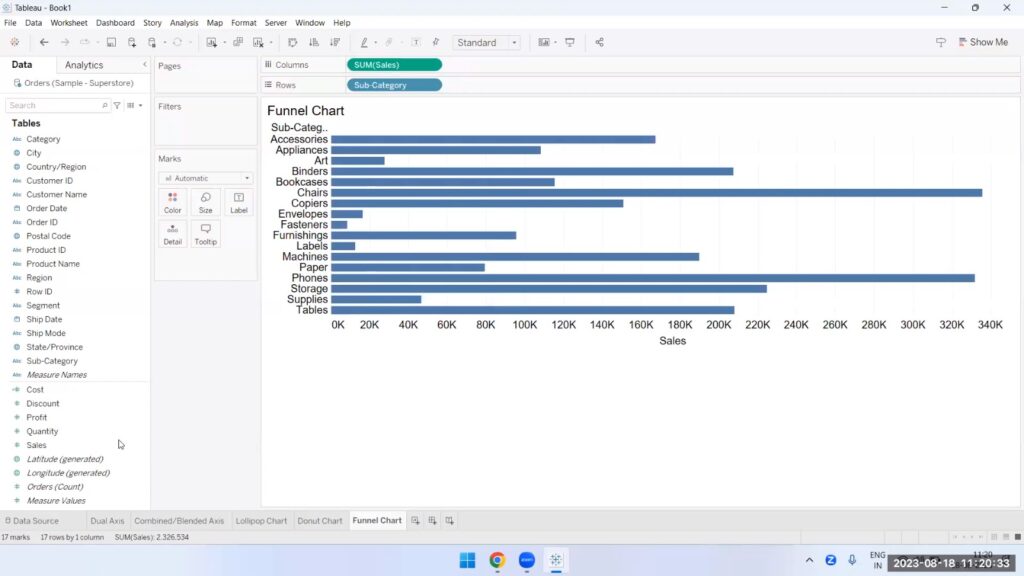
Step:2
Step-3:
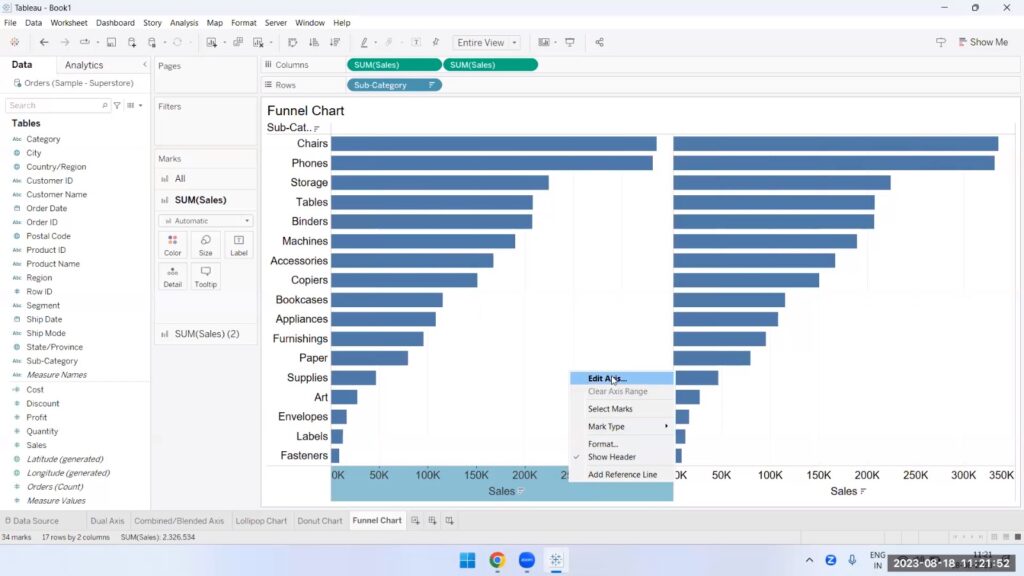
Step-4:
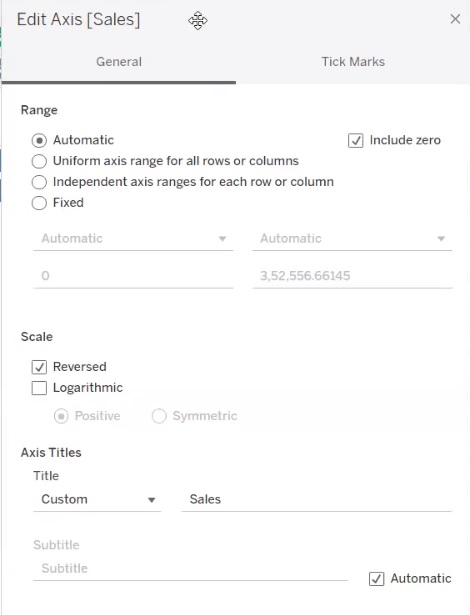
Formatting:
Recent Comments