Author Prasi

Two roads diverged in a yellow wood,And sorry I could not travel bothAnd be one traveler, long I stoodAnd looked down one as far as I couldTo where it bent in the undergrowth; Then took the other, as just as… Continue Reading →
Dashboard-2: Get data from Excel to the database: DAX query to highlight highest: Power query to extract Max and min date: Dax measure: Monthly Disbursement for last month: Portfolio at risk: Invalid loans report: Grouping the table based on a… Continue Reading →

Sample statistics: We describe the sample which is subset of the entire population using sample statistics. The sample statistics usually characterize the sample and not the population. Sample statistics can broadly classified into two type – Standard deviation (SD) of… Continue Reading →
Probability distributions: Case: People who don’t smoke live longer than people who smoke. random variable: Any variable which is subjected to chance and the behavior of random variable is governed by their probability distributions. On studying a small group of people… Continue Reading →
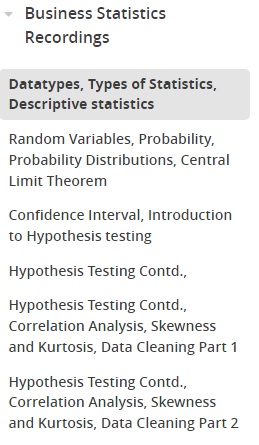
Descriptive vs Inferential: Descriptive: everyday happenings such as accidents, prices of goods, business, incomes, epidemics, sports data, population data. Inferential: uses mathematical tools to make forecasts and projections by analyzing the given data Datatypes: Population and samples: Types of statistics:… Continue Reading →

KPI’s as DAX measures for winning measures: CALCULATE used to calculate the number of matches.COUNTROWS counts the number of rows essentially counting the total number of matches in the dataset.a condition or filter is applied to checks if the “toss_winner”… Continue Reading →
Practice: Current Year sales: Previous Year Sales: Formatting profitablity: Steps building Dashboard: 1.First adjust dashboard size as per your requirement2.Ensure Floating selected and drag vertical container, Go to Layout and adjust its x,y and Height and Width3.Click on Tiled, Add… Continue Reading →

For primary key and Unique key in a table, index is created automatically. Using indexes appropriately can significantly improve query efficiency for large tables and sorting/grouping operations. Create indexes to increase the performance of query. Like tableau’s context filter that… Continue Reading →
Creating triggers: Before insert trigger: To Create before insert trigger to make sure any new value of Working hours, if it is negative, then it should be inserted as positive. — Create the table create table emp_bit(name varchar(55),occupation varchar (100),working_date… Continue Reading →